Diupdate
2022 Model+ (M1D)
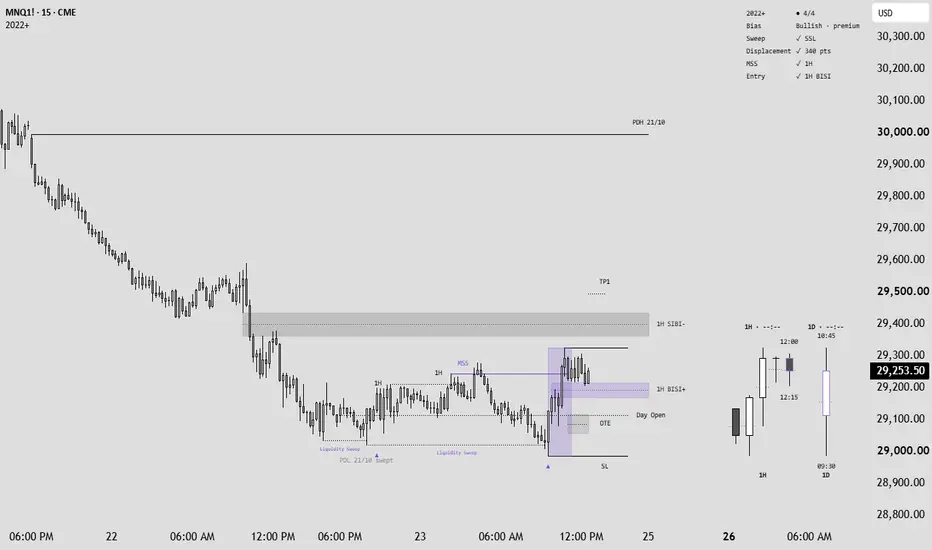
2022 Model+
Maps the ICT 2022 Model sequence on the chart and frames it against a multi-timeframe read of structure, liquidity and imbalance.
The 2022 Model is a sequence, not a pattern:
Liquidity is raided, price displaces away from the raid, and the displacement leaves a fair value gap that becomes the entry reference. This tool marks the first two stages where they actually happen and draws the context the third is read against.
The marker
A swing pool is raided by a wick and the candle closes back inside it — a raid that failed, not a break. That arms a setup. If price then displaces away from the raid extreme by more than the threshold before the setup expires, the marker fires: the raided level draws dotted back to where it formed, the leg is shaded, and a label reports its size. A close back through the raided level cancels the setup instead, because the raid held. A deeper wick while the setup is live re-measures from the new extreme.
The threshold is a share of the previous day's range or a fixed point distance. The scaled option is the default and is measured against the day rather than against chart bars, so the same setting means the same thing on any chart timeframe and travels across futures, metals and crypto.
Confirmed events only
Every marker, level and zone is recorded when the candle that produced it closes, and its position is not recalculated afterwards. The forming candle can draw nothing and remove nothing — a setup found an hour ago sits where it was found, and stays until its own state or the display cap retires it, not until the calculation window moves past it. Alerts follow the same rule.
Three timeframes
Swept liquidity, market structure shifts and fair value gaps are each read on three timeframes at once — a primary higher timeframe plus a mid and a low layer, all set in one place.
Each of the three is defined once and shared, so the layers can never disagree about what they are looking at, and the higher timeframe is always served first. A level already claimed by a senior timeframe is not drawn again by a junior one, because that is the same event seen at finer resolution. A lower-timeframe read at its own level still draws — catching the move before the higher timeframe confirms it is the entire point of the layer.
Swept liquidity.
A swing high or low that a later candle raids and then closes back inside. Every sweep draws identically whatever its timeframe, because a spent pool is a spent pool; the label carries the timeframe, which is the one thing the line cannot express.
Market structure shifts.
A true swing broken by a body close. A true swing is a level price actually turned at: a swing low sits where a down candle gives way to an up candle, not merely at a low that happens to sit below its neighbours. The first close beyond the swing's full wick extreme marks the shift; later closes past it are continuation. The three layers rank by weight and style so the timeframe of a shift reads at a glance.
Fair value gaps.
BISI+ and SIBI- zones, gated by gap height and by the displacement that opened them. A zone moves through live, active, inverted and spent, and its border changes with each; that state advances on chart bars, so a zone is marked entered by the bar that actually enters it. Each zone starts at the exact bar whose wick formed its defining edge rather than at a timeframe boundary, so it is always clear which candle the imbalance came off. Overlapping and stacked zones are thinned against a shared budget, so the zone count on the chart is the number set rather than that number once per layer.
The day
The current day's open, high, low and quadrant ladder, projected across price as a live premium and discount reference. The day boundary is either midnight New York or the symbol's own daily roll.
Beside price, the day is drawn as a projected candle — whole, or opened up into its own quarters or sixths. Split, it also draws dividers and each block's high and low back onto the chart, so the internal shape of the day reads in place as well as beside it. A countdown shows the time left on the block currently forming.
Context
Previous-day levels.
The prior day's high, low and midpoint. A level runs to the right while it is still live and stops at the wick that swept it once taken, so the line spans exactly the window in which the level mattered.
SMT divergence.
Where a swept level was taken on the chart symbol but the correlated market failed to take its matching swing, the two extremes are joined. Index futures, metals and major crypto pair automatically; any symbol can be set manually. A divergence price later trades back through is marked broken rather than removed.
A four-row console reporting day bias, premium or discount, which side the last higher-timeframe sweep took, and which of the previous day's pools have already gone. Everything else draws on the chart at the price it happened, so the console does not repeat it.
Alerts on confirmed closes only, for swept liquidity and structure shifts on each of the three layers, and for the model's own sweep-and-reclaim moment. The forming candle can draw on the chart but can never fire an alert.
Settings
Grouped in reading order: the model first, then the daily frame, the projected candle, the timeframe engine, then each context layer and finally presentation. Every element switches off independently, and colour, width and label size are exposed throughout.
Notes
A layer whose timeframe does not sit between the chart and the primary higher timeframe is hidden rather than drawn wrongly.
SMT is unavailable in bar replay — replay rewinds the chart symbol alone, so the correlated symbol keeps returning live data and the two no longer line up. Nothing is drawn rather than something wrong. It is also silent if a paired symbol does not resolve on your data plan; set the symbol manually.
Disclaimer
This is an analysis tool. It marks structure and delivery — it does not produce trade signals, entries, targets or position sizing.
This is not financial advice. Markets carry risk and past behaviour does not predict future behaviour; every decision taken using this tool is your own.
Maps the ICT 2022 Model sequence on the chart and frames it against a multi-timeframe read of structure, liquidity and imbalance.
The 2022 Model is a sequence, not a pattern:
Liquidity is raided, price displaces away from the raid, and the displacement leaves a fair value gap that becomes the entry reference. This tool marks the first two stages where they actually happen and draws the context the third is read against.
The marker
A swing pool is raided by a wick and the candle closes back inside it — a raid that failed, not a break. That arms a setup. If price then displaces away from the raid extreme by more than the threshold before the setup expires, the marker fires: the raided level draws dotted back to where it formed, the leg is shaded, and a label reports its size. A close back through the raided level cancels the setup instead, because the raid held. A deeper wick while the setup is live re-measures from the new extreme.
The threshold is a share of the previous day's range or a fixed point distance. The scaled option is the default and is measured against the day rather than against chart bars, so the same setting means the same thing on any chart timeframe and travels across futures, metals and crypto.
Confirmed events only
Every marker, level and zone is recorded when the candle that produced it closes, and its position is not recalculated afterwards. The forming candle can draw nothing and remove nothing — a setup found an hour ago sits where it was found, and stays until its own state or the display cap retires it, not until the calculation window moves past it. Alerts follow the same rule.
Three timeframes
Swept liquidity, market structure shifts and fair value gaps are each read on three timeframes at once — a primary higher timeframe plus a mid and a low layer, all set in one place.
Each of the three is defined once and shared, so the layers can never disagree about what they are looking at, and the higher timeframe is always served first. A level already claimed by a senior timeframe is not drawn again by a junior one, because that is the same event seen at finer resolution. A lower-timeframe read at its own level still draws — catching the move before the higher timeframe confirms it is the entire point of the layer.
Swept liquidity.
A swing high or low that a later candle raids and then closes back inside. Every sweep draws identically whatever its timeframe, because a spent pool is a spent pool; the label carries the timeframe, which is the one thing the line cannot express.
Market structure shifts.
A true swing broken by a body close. A true swing is a level price actually turned at: a swing low sits where a down candle gives way to an up candle, not merely at a low that happens to sit below its neighbours. The first close beyond the swing's full wick extreme marks the shift; later closes past it are continuation. The three layers rank by weight and style so the timeframe of a shift reads at a glance.
Fair value gaps.
BISI+ and SIBI- zones, gated by gap height and by the displacement that opened them. A zone moves through live, active, inverted and spent, and its border changes with each; that state advances on chart bars, so a zone is marked entered by the bar that actually enters it. Each zone starts at the exact bar whose wick formed its defining edge rather than at a timeframe boundary, so it is always clear which candle the imbalance came off. Overlapping and stacked zones are thinned against a shared budget, so the zone count on the chart is the number set rather than that number once per layer.
The day
The current day's open, high, low and quadrant ladder, projected across price as a live premium and discount reference. The day boundary is either midnight New York or the symbol's own daily roll.
Beside price, the day is drawn as a projected candle — whole, or opened up into its own quarters or sixths. Split, it also draws dividers and each block's high and low back onto the chart, so the internal shape of the day reads in place as well as beside it. A countdown shows the time left on the block currently forming.
Context
Previous-day levels.
The prior day's high, low and midpoint. A level runs to the right while it is still live and stops at the wick that swept it once taken, so the line spans exactly the window in which the level mattered.
SMT divergence.
Where a swept level was taken on the chart symbol but the correlated market failed to take its matching swing, the two extremes are joined. Index futures, metals and major crypto pair automatically; any symbol can be set manually. A divergence price later trades back through is marked broken rather than removed.
A four-row console reporting day bias, premium or discount, which side the last higher-timeframe sweep took, and which of the previous day's pools have already gone. Everything else draws on the chart at the price it happened, so the console does not repeat it.
Alerts on confirmed closes only, for swept liquidity and structure shifts on each of the three layers, and for the model's own sweep-and-reclaim moment. The forming candle can draw on the chart but can never fire an alert.
Settings
Grouped in reading order: the model first, then the daily frame, the projected candle, the timeframe engine, then each context layer and finally presentation. Every element switches off independently, and colour, width and label size are exposed throughout.
Notes
A layer whose timeframe does not sit between the chart and the primary higher timeframe is hidden rather than drawn wrongly.
SMT is unavailable in bar replay — replay rewinds the chart symbol alone, so the correlated symbol keeps returning live data and the two no longer line up. Nothing is drawn rather than something wrong. It is also silent if a paired symbol does not resolve on your data plan; set the symbol manually.
Disclaimer
This is an analysis tool. It marks structure and delivery — it does not produce trade signals, entries, targets or position sizing.
This is not financial advice. Markets carry risk and past behaviour does not predict future behaviour; every decision taken using this tool is your own.
Catatan Rilis
The PO3 candle countdown works again. The timer above the projected daily candle sat at --:--:-- and never counted, most visibly with the day shown as one whole candle. It was gated on the bar being a realtime bar, and the countdown label is only ever built on the last bar of the chart — a bar that stays historical until a fresh tick arrives after the script loads, which on a delayed feed or through a quiet stretch can be a long time or never. The clock it counts against is the wall clock, not the bar, so that gate bought nothing and cost the whole feature. It is gone: the countdown now runs whenever a day boundary is known, and shows --:--:-- only once the boundary has passed.
And it counts to the day's real close.
The boundary was taken as twenty-four hours from the day's first bar. A futures day runs twenty-three, so on the Daily Bar boundary setting the countdown overshot by an hour. It now reads the symbol's own daily close. Every block in a split day is clipped to that same close, so the last quarter or sixth of the day can no longer count past the end of it.
Volume Imbalances are absorbed into the gaps. A Volume Imbalance — a gap between two candles' BODIES that their wicks still trade through — is part of the same imbalance as the Fair Value Gap beside it, and measuring the wick gap alone understates the region. A body gap on either seam of the displacement candle now EXTENDS the zone out to that body edge, so one zone carries the whole imbalance. This is the same reading the PO3 Matrix+ gap engine uses. The new setting, Absorb Volume Imbalances into Gaps, is on by default; turned off, a zone is the wick gap alone as before. It applies to all three timeframe layers.
The defaults are the settings the tool is actually run on. Displacement is measured in Points at 125 rather than as a share of the daily range, the day boundary is the symbol's own Daily Bar rather than midnight, six markers are kept rather than eight, broken SMTs are removed, spent gaps are not kept, Max MSS Shown is 2, and the MSS labels are small. That is a quieter chart on load and one less pass through the settings panel. Every one of them is still a setting; put back whichever you preferred.
Every other default is as it was, and nothing changes in how sweeps, structure shifts, SMT, the daily range or the previous-day levels are found or drawn.
Catatan Rilis
Fixed the PO3 candle split after a holiday session. In Daily Bar mode the day rolled on the daily bar, and after a holiday early close the chart folds that shortened session into the next day's daily bar, so the roll skipped an evening, the day ran on for two sessions and the last block of a 4 x 6H or 6 x 4H split swallowed the whole next day with a dead countdown. The day now rolls on the symbol's own session open, so a holiday session is its own day, and the day's close can never sit more than 24 hours past its open. Midnight (True Day) was never affected. Nothing changes in what is detected or drawn.
Catatan Rilis
A dark chart themeChart theme, in the Labels settings, has two options. Light is the default and draws exactly as before. Dark lightens every colour the script draws on the chart so it reads on a dark background: the gaps, the displacement leg, the structure shifts and the SMT are lifted toward white, and the black lines and labels - sweeps, the daily range, the previous-day levels, the PO3 candle's outline and its dividers - turn light grey. Colours you have already set are kept and lifted rather than replaced. The dashboard keeps its own light panel either way.
Softer fair value gaps
The gap fills are lighter by default, and the border of a live gap is softened to match, so the zones sit behind price instead of over it. A gap that has been entered or spent fades further, as before. If you had set your own gap colours they are kept; use Reset settings to pick up the new defaults.
Fixed "Memory limits exceeded" on higher timeframe charts
On a chart at or above the MTF Engine timeframe - a daily chart on the default settings, for example - the timeframe layers draw nothing, but they still loaded years of lower timeframe history in the background, and on a long daily chart that ran out of memory before the script could draw anything, including the note asking you to raise the MTF Engine timeframe. A layer that cannot draw no longer loads anything. On every chart where the layers do draw, nothing changes.
Nothing else moves
Detection, every module, and every other setting are unchanged.
Catatan Rilis
Suspension blocksThree higher timeframe candles in the same direction, each opening beyond the previous close, have a volume imbalance on both sides of the middle candle. That leg is now drawn as one zone from the first candle's close to the last candle's open and labelled SB+ or SB-, in place of the gap. It can qualify without a wick gap, because the bodies never trade back through the leg. On by default: Detect Suspension Blocks, in the Fair Value Gaps settings.
A single volume imbalance is still absorbed into the BISI or SIBI beside it, as before.
No overlapping gaps
Overlap Tolerance now defaults to 0, so a gap that shares any price with a gap already drawn is not drawn. Higher timeframes are drawn first, so the higher timeframe gap is the one kept. Raise the tolerance to allow some overlap back.
Thinner sweep lines
Sweep lines, the raided levels of the model and a taken PDH or PDL now draw at width 1. Line Width, in the HTF Sweeps settings, sets it.
New dashboard look
The dashboard is now a clean panel: the name, the instrument and the timeframe, then the day, day bias, zone, HTF sweep and PD sweep. No fill and no gridlines, one frame, and the text follows the chart theme. A row with nothing to report is left out.
Catatan Rilis
Cleaner look and a HTF candleThe chart now reads like the model itself: blue for bullish and red for bearish, one higher timeframe layer by default, a small "Liquidity Sweep" name on the swept pool, a plain "MSS" on the structure shift and a ▲ / ▼ mark where the leg confirms (hover it for the points). Each gap carries a dotted CE line through its middle. The mid and low timeframe layers, the leg box, the daily quadrants and PD EQ are still in the settings, just off by default. New: two slots of HTF candles beside price. Inside, the last 5 candles of a timeframe you pick (15m and up, 1H by default); outside, the daily candle. Each carries its name, a countdown and the New York times of its high and low. The day's high and low now read CDH and CDL. The PO3 candle is still in the settings, off by default. Use Reset settings to pick up the new defaults.
Catatan Rilis
The model, step by stepThe latest 2022 sequence is now drawn on the chart as it forms: the pool that was raided, the displacement leg boxed from the raid extreme, the MSS line and the gap the move left. A raid that is closed back through or runs out of window leaves the chart. Show Model Steps, in the Model Steps settings, turns it off.
Checklist panel
The dashboard is now a vertical checklist in the order the setup forms: the day's bias, then Sweep, Displacement, MSS and Entry, each with a tick or a cross and a count of steps done on the title row. Hover a row for its prices and times. The entry is the nearest gap that formed after the raid, or the OTE band once a shift has printed. Dashboard Look switches back to the Classic framed panel.
OTE pullback, stop and target
After the MSS the OTE band is drawn from the MSS to the live candle, 0.62 to 0.79 of the leg with the 0.705 line inside, and short SL and TP1 stubs show where the stop and first target sit. Show OTE Pullback, OTE From, OTE To and the stub length are in the Setup settings.
New look
Violet for bullish and dark grey for bearish, width 1 lines and a sentence-case panel. Both step colours can be changed in the Model Steps settings. The day high and low lines no longer carry names, and Day Open sits beside CDH on one line when they share a price.
Catatan Rilis
Update- The day high and low lines carry their names again: CDH and CDL. A name that would sit on the Day Open is left off, so two names never share one price.
- One candle block past price. The forming day now sits in the HTF candles' daily slot, beside the 1H candles, and the separate PO3 day candle no longer draws while that slot is on.
- New Fib block step in the panel. The dealing range is the high and low of the last 20 IPDA days (finished days only). No longs with the entry at 0.80-0.90 of it, no shorts at 0.20-0.30. Before there is a entry, the live price is measured. Turn it off under Setup.

Pernyataan Penyangkalan
Informasi dan publikasi ini tidak dimaksudkan, dan bukan merupakan, saran atau rekomendasi keuangan, investasi, trading, atau jenis lainnya yang diberikan atau didukung oleh TradingView. Baca selengkapnya di Ketentuan Penggunaan.
Pernyataan Penyangkalan
Informasi dan publikasi ini tidak dimaksudkan, dan bukan merupakan, saran atau rekomendasi keuangan, investasi, trading, atau jenis lainnya yang diberikan atau didukung oleh TradingView. Baca selengkapnya di Ketentuan Penggunaan.