OPEN-SOURCE SCRIPT
Diupdate 4H SMA20/SMA50 Cross Proximity
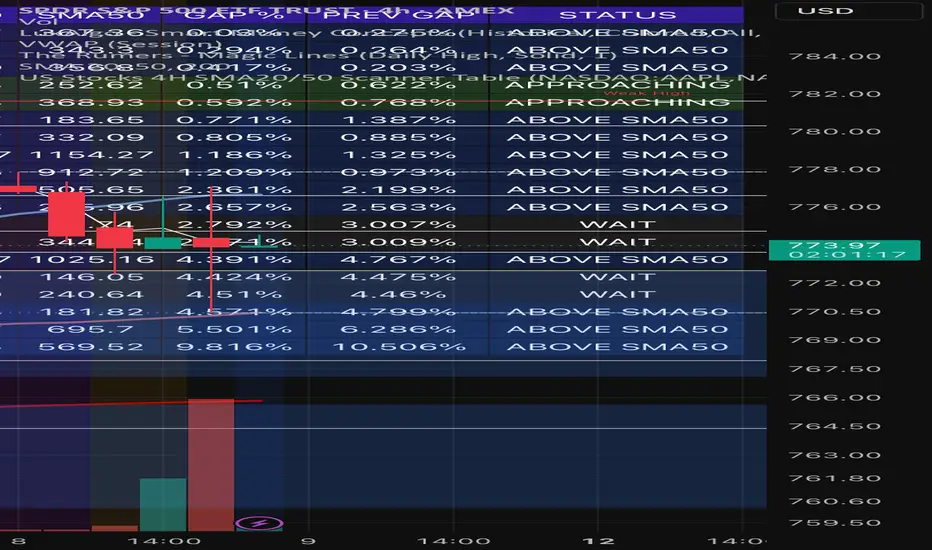
The script “4H Bullish SMA20/50 Proximity” is designed to find stocks where the 20-period Simple Moving Average (SMA20) is approaching the 50-period Simple Moving Average (SMA50) from below, potentially signaling an upcoming bullish crossover.
Here is what each part does.
1. Script settings
maxGap = input.float(1.0, "Maximum gap (%)", minval=0.01, step=0.05)
minGap = input.float(0.0, "Minimum gap (%)", minval=0.0, step=0.05)
These settings let you control how close the two moving averages must be.
- Maximum gap = 1.0%: The averages must be no more than 1% apart.
- Minimum gap = 0.0%: Allows all gaps from zero upward.
For example, if SMA50 is 100 and SMA20 is 99.80, the gap is 0.20%, so it meets the default distance thresholds.
2. Calculate the moving averages
sma20 = ta.sma(close, 20)
sma50 = ta.sma(close, 50)
- ta.sma(close, 20) calculates the average closing price of the last 20 candles.
- ta.sma(close, 50) calculates the average closing price of the last 50 candles.
Important: The script uses the timeframe selected in Pine Screener. To scan using 4-hour candles, set the screener interval to 4 hours.
3. Calculate the distance between the SMAs
gap = sma50 != 0 ? math.abs(sma20 - sma50) / math.abs(sma50) * 100 : na
This calculates the percentage distance between SMA20 and SMA50 relative to SMA50.
SMA20 SMA50 Gap
99.00 100.00 1.00%
99.50 100.00 0.50%
99.80 100.00 0.20%
99.95 100.00 0.05%
The smaller the gap, the closer the averages are to crossing.
4. Identify an approaching bullish crossover
approaching = sma20 < sma50 and gap >= minGap and gap <= maxGap and gap < gap[1]
This is the main condition. All four requirements must be true:
1. sma20 < sma50 — SMA20 is below SMA50, so the bullish crossover has not happened yet.
2. gap >= minGap — The distance meets your minimum threshold.
3. gap <= maxGap — The distance is within your maximum threshold.
4. gap < gap[1] — The distance is smaller than it was on the previous candle.
For example, if the gap decreases from 0.70% to 0.45% to 0.20%, the stock meets the narrowing-gap condition, provided the other requirements are satisfied.
If the gap starts increasing again, the approaching signal becomes false.
5. Make the results available to Pine Screener
plot(gap, "SMA Gap %", display=display.data_window)
plot(approaching ? 1 : 0, "Bullish Setup (1 = Yes)")
plot(sma20 < sma50 ? 1 : 0, "SMA20 Below SMA50")
These three plots expose values that you can use when filtering stocks.
Plot name Output Purpose
SMA Gap % Percentage Shows how close the SMAs are
Bullish Setup (1 = Yes) 1 or 0 Identifies stocks meeting all conditions
SMA20 Below SMA50 1 or 0 Confirms that SMA20 remains below SMA50
In Pine Screener, filter Bullish Setup (1 = Yes) to equal 1. That leaves stocks satisfying the approach conditions.
Note that SMA Gap % uses display.data_window, so it is available in the Data Window rather than being drawn as a visible chart line.
Recommended settings for your strategy
Maximum gap
0.50%
0.1%
1%
2%
Minimum gap
0.00%
0%
0.25%
0.5%
This configuration looks for a narrowing gap between 0.00% and 0.50% on the 4-hour timeframe.
Copy these settings
My starting recommendation is a maximum gap of 0.50% and a minimum of 0.00%. This is a tighter starting filter than 1%, but it may miss some early setups.
Limitation to remember: A narrowing gap does not guarantee a crossover. The averages may separate again, and this script does not estimate how many candles remain until the crossover.
Here is what each part does.
1. Script settings
maxGap = input.float(1.0, "Maximum gap (%)", minval=0.01, step=0.05)
minGap = input.float(0.0, "Minimum gap (%)", minval=0.0, step=0.05)
These settings let you control how close the two moving averages must be.
- Maximum gap = 1.0%: The averages must be no more than 1% apart.
- Minimum gap = 0.0%: Allows all gaps from zero upward.
For example, if SMA50 is 100 and SMA20 is 99.80, the gap is 0.20%, so it meets the default distance thresholds.
2. Calculate the moving averages
sma20 = ta.sma(close, 20)
sma50 = ta.sma(close, 50)
- ta.sma(close, 20) calculates the average closing price of the last 20 candles.
- ta.sma(close, 50) calculates the average closing price of the last 50 candles.
Important: The script uses the timeframe selected in Pine Screener. To scan using 4-hour candles, set the screener interval to 4 hours.
3. Calculate the distance between the SMAs
gap = sma50 != 0 ? math.abs(sma20 - sma50) / math.abs(sma50) * 100 : na
This calculates the percentage distance between SMA20 and SMA50 relative to SMA50.
SMA20 SMA50 Gap
99.00 100.00 1.00%
99.50 100.00 0.50%
99.80 100.00 0.20%
99.95 100.00 0.05%
The smaller the gap, the closer the averages are to crossing.
4. Identify an approaching bullish crossover
approaching = sma20 < sma50 and gap >= minGap and gap <= maxGap and gap < gap[1]
This is the main condition. All four requirements must be true:
1. sma20 < sma50 — SMA20 is below SMA50, so the bullish crossover has not happened yet.
2. gap >= minGap — The distance meets your minimum threshold.
3. gap <= maxGap — The distance is within your maximum threshold.
4. gap < gap[1] — The distance is smaller than it was on the previous candle.
For example, if the gap decreases from 0.70% to 0.45% to 0.20%, the stock meets the narrowing-gap condition, provided the other requirements are satisfied.
If the gap starts increasing again, the approaching signal becomes false.
5. Make the results available to Pine Screener
plot(gap, "SMA Gap %", display=display.data_window)
plot(approaching ? 1 : 0, "Bullish Setup (1 = Yes)")
plot(sma20 < sma50 ? 1 : 0, "SMA20 Below SMA50")
These three plots expose values that you can use when filtering stocks.
Plot name Output Purpose
SMA Gap % Percentage Shows how close the SMAs are
Bullish Setup (1 = Yes) 1 or 0 Identifies stocks meeting all conditions
SMA20 Below SMA50 1 or 0 Confirms that SMA20 remains below SMA50
In Pine Screener, filter Bullish Setup (1 = Yes) to equal 1. That leaves stocks satisfying the approach conditions.
Note that SMA Gap % uses display.data_window, so it is available in the Data Window rather than being drawn as a visible chart line.
Recommended settings for your strategy
Maximum gap
0.50%
0.1%
1%
2%
Minimum gap
0.00%
0%
0.25%
0.5%
This configuration looks for a narrowing gap between 0.00% and 0.50% on the 4-hour timeframe.
Copy these settings
My starting recommendation is a maximum gap of 0.50% and a minimum of 0.00%. This is a tighter starting filter than 1%, but it may miss some early setups.
Limitation to remember: A narrowing gap does not guarantee a crossover. The averages may separate again, and this script does not estimate how many candles remain until the crossover.
Catatan Rilis
newSkrip open-source
Dengan semangat TradingView yang sesungguhnya, pembuat skrip ini telah menjadikannya sebagai sumber terbuka, sehingga para trader dapat meninjau dan memverifikasi fungsinya. Salut untuk penulisnya! Meskipun Anda dapat menggunakannya secara gratis, perlu diingat bahwa penerbitan ulang kode ini tunduk pada Tata Tertib kami.

Pernyataan Penyangkalan
Informasi dan publikasi ini tidak dimaksudkan, dan bukan merupakan, saran atau rekomendasi keuangan, investasi, trading, atau jenis lainnya yang diberikan atau didukung oleh TradingView. Baca selengkapnya di Ketentuan Penggunaan.
Skrip open-source
Dengan semangat TradingView yang sesungguhnya, pembuat skrip ini telah menjadikannya sebagai sumber terbuka, sehingga para trader dapat meninjau dan memverifikasi fungsinya. Salut untuk penulisnya! Meskipun Anda dapat menggunakannya secara gratis, perlu diingat bahwa penerbitan ulang kode ini tunduk pada Tata Tertib kami.
Pernyataan Penyangkalan
Informasi dan publikasi ini tidak dimaksudkan, dan bukan merupakan, saran atau rekomendasi keuangan, investasi, trading, atau jenis lainnya yang diberikan atau didukung oleh TradingView. Baca selengkapnya di Ketentuan Penggunaan.