Supertrend Zones + RSI Dots + VIX + HH LL
# What this indicator does
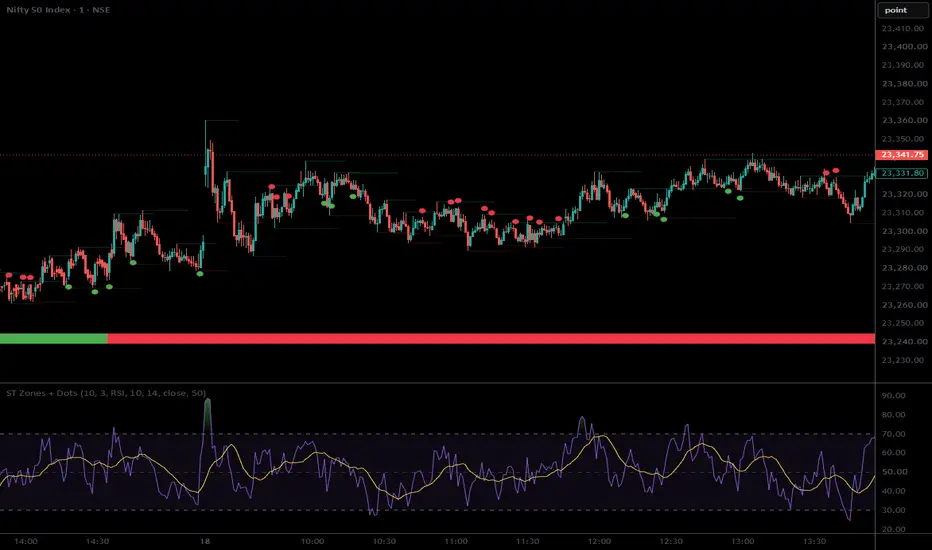
This is a combined trading tool for TradingView. It shows an RSI in its own pane below the chart. On top of your price chart it also shows trend zones, entry dots, a market-volatility strip and market-structure marks.
## 1. Trend zones on the price chart
The background is shaded green when the price Supertrend says the market is in an uptrend (a "buying zone") and red when it says downtrend (a "selling zone"). You can also switch on small BUY and SELL markers where a new zone starts, and show the Supertrend line itself.
## 2. RSI pane
The lower pane shows the RSI line with the usual overbought (70), middle (50) and oversold (30) levels. It has coloured fades near the extremes, and a yellow smoothed RSI line. The smoothing type can be a simple average, exponential, weighted or others, and Bollinger Bands around it are optional. An optional divergence detector marks "Bull" and "Bear" labels when price and RSI disagree.
## 3. Entry dots
The dots are timing signals that only appear in the direction of the current zone:
- **Green dot below a candle:** the market is in a buying zone and the RSI has just crossed up through the middle level.
- **Red dot above a candle:** the market is in a selling zone and the RSI has just crossed down through the middle level.
You can base the signal on the raw RSI or the smoothed RSI.
## 4. India VIX strip
A thin bar runs along the bottom of the price chart. It is green while the India VIX Supertrend is positive (uptrend) and red while it is negative (downtrend), and it changes colour as VIX flips. It is calculated on the VIX itself, with its own length and sensitivity settings. You can swap the colours if you'd rather green mean falling volatility.
## 5. Market structure (Higher Highs, Higher Lows, Lower Highs, Lower Lows)
The script finds swing highs and swing lows, which are confirmed a few bars after they form. It compares each one with the previous swing and labels it: HH, HL, LH or LL. These labels show at a glance whether the market is making higher peaks and troughs (bullish) or lower ones (bearish).
It also draws dotted support and resistance lines from this structure. Each line stops when a new level replaces it and extends to the right while it is still active.
## 6. Alerts
You can set alerts for:
- the start of a buying or selling zone
- each green or red dot
- bullish or bearish divergence
- every type of structure label
- the first lower low after a bullish sequence
- the first higher high after a bearish one
## How the pieces work together
The zones tell you the bias. The dots give you the entry timing inside that bias. The VIX strip adds a market-wide volatility filter. The structure labels and support/resistance lines show where price is respecting or breaking recent swings. A setup is strongest when several of them agree, for example a buying zone, a green dot, a positive VIX strip and a fresh higher low.
Everything can be switched on or off and recoloured from the settings, which are grouped by feature.
This is a combined trading tool for TradingView. It shows an RSI in its own pane below the chart. On top of your price chart it also shows trend zones, entry dots, a market-volatility strip and market-structure marks.
## 1. Trend zones on the price chart
The background is shaded green when the price Supertrend says the market is in an uptrend (a "buying zone") and red when it says downtrend (a "selling zone"). You can also switch on small BUY and SELL markers where a new zone starts, and show the Supertrend line itself.
## 2. RSI pane
The lower pane shows the RSI line with the usual overbought (70), middle (50) and oversold (30) levels. It has coloured fades near the extremes, and a yellow smoothed RSI line. The smoothing type can be a simple average, exponential, weighted or others, and Bollinger Bands around it are optional. An optional divergence detector marks "Bull" and "Bear" labels when price and RSI disagree.
## 3. Entry dots
The dots are timing signals that only appear in the direction of the current zone:
- **Green dot below a candle:** the market is in a buying zone and the RSI has just crossed up through the middle level.
- **Red dot above a candle:** the market is in a selling zone and the RSI has just crossed down through the middle level.
You can base the signal on the raw RSI or the smoothed RSI.
## 4. India VIX strip
A thin bar runs along the bottom of the price chart. It is green while the India VIX Supertrend is positive (uptrend) and red while it is negative (downtrend), and it changes colour as VIX flips. It is calculated on the VIX itself, with its own length and sensitivity settings. You can swap the colours if you'd rather green mean falling volatility.
## 5. Market structure (Higher Highs, Higher Lows, Lower Highs, Lower Lows)
The script finds swing highs and swing lows, which are confirmed a few bars after they form. It compares each one with the previous swing and labels it: HH, HL, LH or LL. These labels show at a glance whether the market is making higher peaks and troughs (bullish) or lower ones (bearish).
It also draws dotted support and resistance lines from this structure. Each line stops when a new level replaces it and extends to the right while it is still active.
## 6. Alerts
You can set alerts for:
- the start of a buying or selling zone
- each green or red dot
- bullish or bearish divergence
- every type of structure label
- the first lower low after a bullish sequence
- the first higher high after a bearish one
## How the pieces work together
The zones tell you the bias. The dots give you the entry timing inside that bias. The VIX strip adds a market-wide volatility filter. The structure labels and support/resistance lines show where price is respecting or breaking recent swings. A setup is strongest when several of them agree, for example a buying zone, a green dot, a positive VIX strip and a fresh higher low.
Everything can be switched on or off and recoloured from the settings, which are grouped by feature.

Pernyataan Penyangkalan
Informasi dan publikasi ini tidak dimaksudkan, dan bukan merupakan, saran atau rekomendasi keuangan, investasi, trading, atau jenis lainnya yang diberikan atau didukung oleh TradingView. Baca selengkapnya di Ketentuan Penggunaan.
Pernyataan Penyangkalan
Informasi dan publikasi ini tidak dimaksudkan, dan bukan merupakan, saran atau rekomendasi keuangan, investasi, trading, atau jenis lainnya yang diberikan atau didukung oleh TradingView. Baca selengkapnya di Ketentuan Penggunaan.