MYND Volume Profile Value Zones v1.0
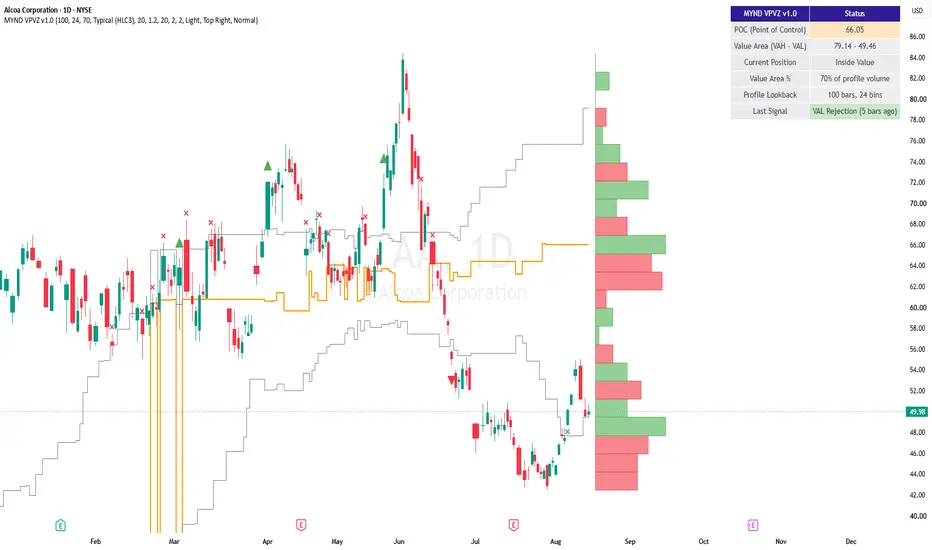
MYND Volume Profile Value Zones [v1.0]
A from-scratch rolling Volume Profile - see where volume actually traded, find the Point of Control, and watch price react to a self-updating Value Area.
WHAT IT DOES
This indicator bins the last N bars' volume by price into a live histogram, finds the Point of Control (POC - the single price level with the most traded volume), and expands a Value Area (default 70% of profile volume) outward from the POC using the same standard "expand toward the side with more incremental volume" method real volume profile tools use. Unlike session/weekly/monthly anchored profiles, this one is fully rolling: it recomputes fresh every bar from a fixed recent lookback window, so it always reflects the same amount of current trading activity rather than growing across a session.
HOW IT WORKS
Each historical bar's entire volume is assigned to one price bin, based on that bar's typical price (HLC3 by default, configurable) - a real, commonly-used technique for building efficient rolling profiles that trades a small amount of intrabar precision for a much cheaper, more robust calculation than distributing volume proportionally across every bin a bar's range touches. The POC is simply the highest-volume bin; the Value Area expands outward from it, one bin at a time toward whichever side carries more volume, until it contains your configured percentage of the total.
Signals fire on Value Area High/Low breakouts (requiring volume confirmation) and rejections (reversion back into value) - a Bounce/Break-style taxonomy shared with MYND Anchored Value Zones for a consistent feel across the suite's value-zone tools.
KEY FEATURES
A live, updating volume profile histogram drawn directly on the chart, colored by whether up-volume or down-volume dominated each price level. Plotted POC and Value Area High/Low lines that update every bar. A dashboard showing the current POC, Value Area range, whether price is currently above, below, or inside value, and the last signal fired. 4 individual alerts plus 3 combo bundles. Light/Dark theme presets plus a colorblind-safe signal color option. Full customization throughout - colors, table size/position, line widths - with tooltips on every setting that benefits from one.
HOW TO USE IT
Works out of the box with sensible defaults - no source configuration required. Scan the histogram for the widest bars (high-interest price levels that tend to act as support/resistance) and thin or gapped areas (levels price tends to move through quickly). Use the POC and Value Area lines as dynamic reference levels the way you would any support/resistance zone, and let the Bounce/Break signals flag when price is actually leaving or failing to leave the current value range.
SETTINGS WORTH TUNING FIRST
Profile Lookback (bars) - shorten to track only very recent trading activity, lengthen for a broader, more stable structural read. Number of Price Bins - more bins for finer resolution, fewer for a cleaner look. Value Area % - 70% is the standard convention, but adjustable.
WHAT THIS TOOL DELIBERATELY DOES NOT DO
POC and Value Area describe where volume already traded, not where price will go next - they're structural context, not a directional forecast. Because of that, this tool does not carry a self-tracking accuracy dashboard the way some other MYND tools do; bolting a prediction-accuracy tracker onto a structural read would be a forced fit. This is also not a session/weekly/monthly anchored profile - it's intentionally the always-current rolling-window variant.
ALERTS
All 7 alerts (4 individual breakout/rejection alerts plus 3 combo bundles) use TradingView's standard alertcondition() system - no special setup required. Add Alert -> Condition -> this script -> pick the named alert from the dropdown.
This tool is provided for informational and educational purposes and does not constitute financial advice. Trading involves risk; past performance and historical patterns do not guarantee future results.
A from-scratch rolling Volume Profile - see where volume actually traded, find the Point of Control, and watch price react to a self-updating Value Area.
WHAT IT DOES
This indicator bins the last N bars' volume by price into a live histogram, finds the Point of Control (POC - the single price level with the most traded volume), and expands a Value Area (default 70% of profile volume) outward from the POC using the same standard "expand toward the side with more incremental volume" method real volume profile tools use. Unlike session/weekly/monthly anchored profiles, this one is fully rolling: it recomputes fresh every bar from a fixed recent lookback window, so it always reflects the same amount of current trading activity rather than growing across a session.
HOW IT WORKS
Each historical bar's entire volume is assigned to one price bin, based on that bar's typical price (HLC3 by default, configurable) - a real, commonly-used technique for building efficient rolling profiles that trades a small amount of intrabar precision for a much cheaper, more robust calculation than distributing volume proportionally across every bin a bar's range touches. The POC is simply the highest-volume bin; the Value Area expands outward from it, one bin at a time toward whichever side carries more volume, until it contains your configured percentage of the total.
Signals fire on Value Area High/Low breakouts (requiring volume confirmation) and rejections (reversion back into value) - a Bounce/Break-style taxonomy shared with MYND Anchored Value Zones for a consistent feel across the suite's value-zone tools.
KEY FEATURES
A live, updating volume profile histogram drawn directly on the chart, colored by whether up-volume or down-volume dominated each price level. Plotted POC and Value Area High/Low lines that update every bar. A dashboard showing the current POC, Value Area range, whether price is currently above, below, or inside value, and the last signal fired. 4 individual alerts plus 3 combo bundles. Light/Dark theme presets plus a colorblind-safe signal color option. Full customization throughout - colors, table size/position, line widths - with tooltips on every setting that benefits from one.
HOW TO USE IT
Works out of the box with sensible defaults - no source configuration required. Scan the histogram for the widest bars (high-interest price levels that tend to act as support/resistance) and thin or gapped areas (levels price tends to move through quickly). Use the POC and Value Area lines as dynamic reference levels the way you would any support/resistance zone, and let the Bounce/Break signals flag when price is actually leaving or failing to leave the current value range.
SETTINGS WORTH TUNING FIRST
Profile Lookback (bars) - shorten to track only very recent trading activity, lengthen for a broader, more stable structural read. Number of Price Bins - more bins for finer resolution, fewer for a cleaner look. Value Area % - 70% is the standard convention, but adjustable.
WHAT THIS TOOL DELIBERATELY DOES NOT DO
POC and Value Area describe where volume already traded, not where price will go next - they're structural context, not a directional forecast. Because of that, this tool does not carry a self-tracking accuracy dashboard the way some other MYND tools do; bolting a prediction-accuracy tracker onto a structural read would be a forced fit. This is also not a session/weekly/monthly anchored profile - it's intentionally the always-current rolling-window variant.
ALERTS
All 7 alerts (4 individual breakout/rejection alerts plus 3 combo bundles) use TradingView's standard alertcondition() system - no special setup required. Add Alert -> Condition -> this script -> pick the named alert from the dropdown.
This tool is provided for informational and educational purposes and does not constitute financial advice. Trading involves risk; past performance and historical patterns do not guarantee future results.

Pernyataan Penyangkalan
Informasi dan publikasi ini tidak dimaksudkan, dan bukan merupakan, saran atau rekomendasi keuangan, investasi, trading, atau jenis lainnya yang diberikan atau didukung oleh TradingView. Baca selengkapnya di Ketentuan Penggunaan.
Pernyataan Penyangkalan
Informasi dan publikasi ini tidak dimaksudkan, dan bukan merupakan, saran atau rekomendasi keuangan, investasi, trading, atau jenis lainnya yang diberikan atau didukung oleh TradingView. Baca selengkapnya di Ketentuan Penggunaan.