Liquidity + HVP + Swing Projection + Low-Vol Range Breakouts
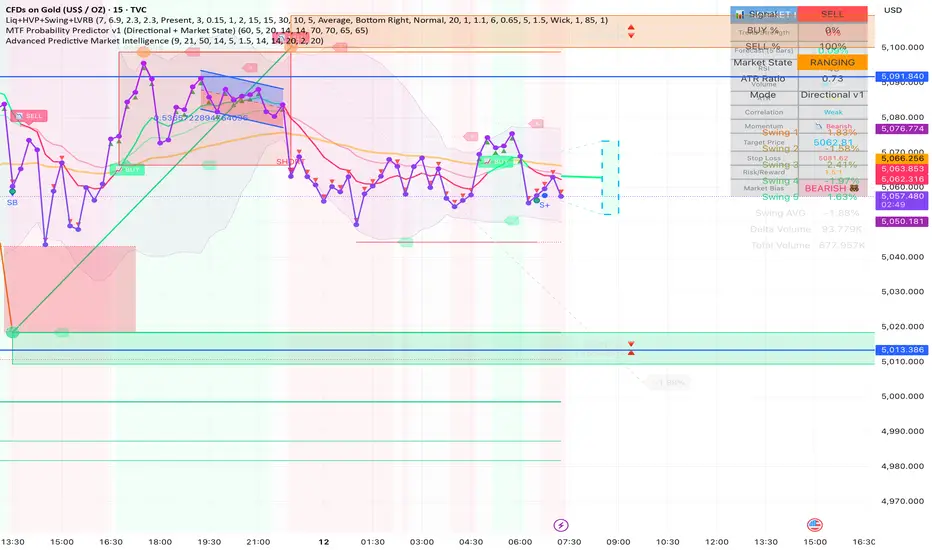
Buyside & Sellside Liquidity: Detects levels where price has pivoted multiple times and draws zones.
Touch & Reject: It doesn't just mark levels; it alerts you when the price enters a zone and provides a "Reject" (RJ) signal if the price hits the zone and closes back outside of it (potential reversal).
Liquidity Voids: Optionally highlights price gaps where liquidity is thin, suggesting the market might return to "fill" those areas.
Institutional Activity: It identifies significant Pivot Highs/Lows that occurred on unusually high volume.
Visual Levels: It marks these points with circles and labels. Large volume spikes at pivots often act as strong support or resistance levels in the future.
Historical Analysis: It measures the percentage move of the last few price swings.
Future Projection: Based on the average (or median) of previous swings, it projects a dashed line to a target price for the current move.
Stats Dashboard: A table in the corner of your chart displays the volume delta (buy vs. sell volume) and the percentage changes of recent swings.
The Squeeze: It looks for a sequence of candles with very small bodies and low Average True Range (ATR). This represents a market in "equilibrium" or consolidation.
The Breakout: When the price finally breaks out of this tight, low-volatility box with a strong candle, it triggers a LONG or SHORT signal.
Touch & Reject: It doesn't just mark levels; it alerts you when the price enters a zone and provides a "Reject" (RJ) signal if the price hits the zone and closes back outside of it (potential reversal).
Liquidity Voids: Optionally highlights price gaps where liquidity is thin, suggesting the market might return to "fill" those areas.
Institutional Activity: It identifies significant Pivot Highs/Lows that occurred on unusually high volume.
Visual Levels: It marks these points with circles and labels. Large volume spikes at pivots often act as strong support or resistance levels in the future.
Historical Analysis: It measures the percentage move of the last few price swings.
Future Projection: Based on the average (or median) of previous swings, it projects a dashed line to a target price for the current move.
Stats Dashboard: A table in the corner of your chart displays the volume delta (buy vs. sell volume) and the percentage changes of recent swings.
The Squeeze: It looks for a sequence of candles with very small bodies and low Average True Range (ATR). This represents a market in "equilibrium" or consolidation.
The Breakout: When the price finally breaks out of this tight, low-volatility box with a strong candle, it triggers a LONG or SHORT signal.

Pernyataan Penyangkalan
Informasi dan publikasi ini tidak dimaksudkan, dan bukan merupakan, saran atau rekomendasi keuangan, investasi, trading, atau jenis lainnya yang diberikan atau didukung oleh TradingView. Baca selengkapnya di Ketentuan Penggunaan.
Pernyataan Penyangkalan
Informasi dan publikasi ini tidak dimaksudkan, dan bukan merupakan, saran atau rekomendasi keuangan, investasi, trading, atau jenis lainnya yang diberikan atau didukung oleh TradingView. Baca selengkapnya di Ketentuan Penggunaan.