Diupdate
Interest Bricks @shrilss
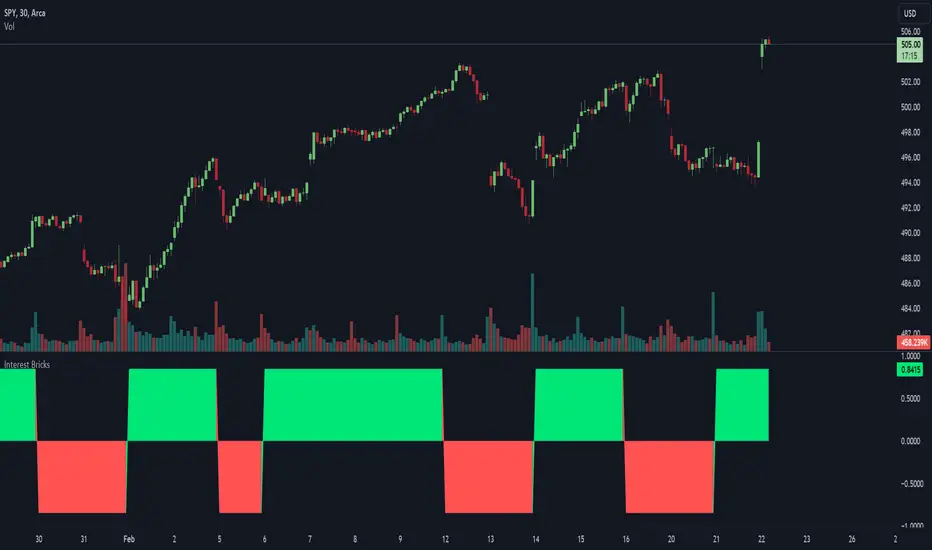
Interest Bricks utilize a unique approach to visualize changes in interest over time. It calculates the difference between the current and previous values of a specified asset's closing price on a daily basis. The resulting value indicates whether there has been an increase, decrease, or no change in interest.
This indicator employs a sine wave plot to represent the trend of interest changes. Positive values of the sine wave indicate increasing interest, while negative values denote decreasing interest. The color of the plot dynamically changes based on the direction of the trend: lime for upward trends and red for downward trends.
This indicator employs a sine wave plot to represent the trend of interest changes. Positive values of the sine wave indicate increasing interest, while negative values denote decreasing interest. The color of the plot dynamically changes based on the direction of the trend: lime for upward trends and red for downward trends.
Catatan Rilis
Added time frame input options.Catatan Rilis
This should fix the repainting hopefully, if not just user higher timeframes.Catatan Rilis
- Script now only fetches historical data, should fix repainting.Catatan Rilis
+ Added a few more timeframes into the dropdown, so users don't have to edit the script themselves if they want to look at weekly bricks on the daily chart.
Pernyataan Penyangkalan
Informasi dan publikasi ini tidak dimaksudkan, dan bukan merupakan, saran atau rekomendasi keuangan, investasi, trading, atau jenis lainnya yang diberikan atau didukung oleh TradingView. Baca selengkapnya di Ketentuan Penggunaan.
Pernyataan Penyangkalan
Informasi dan publikasi ini tidak dimaksudkan, dan bukan merupakan, saran atau rekomendasi keuangan, investasi, trading, atau jenis lainnya yang diberikan atau didukung oleh TradingView. Baca selengkapnya di Ketentuan Penggunaan.