Diupdate
C-Power
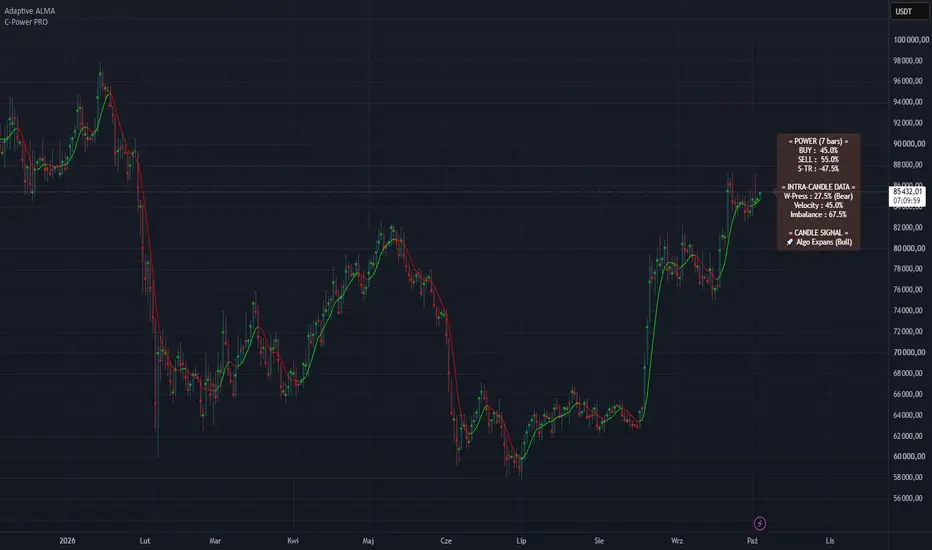
Indicator "C-Power" (candle buy/sell power) and is designed to dynamically measure and display the buying power (Buyers) and selling power (Sellers) over a specific period.
Simply put: the script analyzes recent candles and displays a small label on your chart showing who currently holds the upper hand in the market, along with their respective percentages.
How the Script Works (Step-by-Step)
1. Volume Filtering:
- The script retrieves market volume and smooths it using an ALMA (Arnaud Legoux Moving Average) over a selected period (5 candles by default).
- It protects the chart from anomalies – if an abrupt, massive volume spike occurs (over 3.5 times the average), the script "caps" it so that a single outlier does not distort the overall result.
2. Gap Protection:
- Instead of using just the raw highs and lows of the current candle, the script compares them with the closing price of the previous candle (prev_close). This ensures that price gaps are factored into the market's true momentum.
3. Garman-Klass Volatility Calculation (GK Volatility):
- This is the mathematical core of the script. It utilizes the advanced Garman-Klass formula, which measures market volatility based on the relationship between the open, high, low, and close prices.
- The result is further smoothed by the ALMA filter, delivering a highly stable representation of market volatility that is resilient against market noise.
4. Z-Score and Probability Estimation (Statistics):
- The script measures where the current price sits relative to the candle's midpoint and divides this by the calculated volatility. This creates a statistical value known as a Z-score.
- Using a built-in Cumulative Distribution Function for a normal distribution (normCDF via the error function erf), the script converts this score into a directional weight between 0 and 1. This weight represents the statistical probability of whether the move is inherently bullish or bearish.
5. Determining Final Power (Buy/Sell Power):
- If trading volume data is available for the asset, the script multiplies the volume by this calculated statistical weight.
- If volume data is unavailable (e.g., on certain indices or Forex pairs), the script relies entirely on the mathematical structure of the price action itself (hence the dynamic text update to GK Price).
- These accumulated values over the specified period (e.g., 5 candles) are then converted into percentages (e.g., BUY: 65.0% / SELL: 35.0%).
6. Chart Visualization:
- A text label is generated on the right side of the chart, shifted forward by a user-defined offset (3 candles by default).
- This label smoothly changes color (gradient) depending on who is dominating the market. If buyers have the upper hand, the label turns green (or your custom bullish color). If sellers take control, it turns red. It remains gray when the market is in balance.
Key Advantages of This Script:
- Versatility: It functions seamlessly both on markets with volume data (crypto, stocks) and markets without it (forex).
- Statistical Framework: Rather than guessing a trend based on simple logic like "the price is going up, so buy," it evaluates mathematical probability and volatility.
Conclusion – Overall, this is a dynamic indicator that utilizes mathematical estimations (Garman-Klass volatility, statistical Z-score, and probability distribution) to estimate the power of buyers and sellers over a selected candle lookback period.Typically, similar indicators fetch data from lower timeframes and rely on a simple logic: a red candle means a drop where sellers won, while a green candle means a rise where buyers won. They then simply aggregate the data and determine the buy/sell power based on the ratio of bullish to bearish candles.This indicator, however, attempts to reconstruct those same relationships mathematically on a single timeframe.Soon, I will release an oscillator that will serve as a historical complement to this indicator.
Simply put: the script analyzes recent candles and displays a small label on your chart showing who currently holds the upper hand in the market, along with their respective percentages.
How the Script Works (Step-by-Step)
1. Volume Filtering:
- The script retrieves market volume and smooths it using an ALMA (Arnaud Legoux Moving Average) over a selected period (5 candles by default).
- It protects the chart from anomalies – if an abrupt, massive volume spike occurs (over 3.5 times the average), the script "caps" it so that a single outlier does not distort the overall result.
2. Gap Protection:
- Instead of using just the raw highs and lows of the current candle, the script compares them with the closing price of the previous candle (prev_close). This ensures that price gaps are factored into the market's true momentum.
3. Garman-Klass Volatility Calculation (GK Volatility):
- This is the mathematical core of the script. It utilizes the advanced Garman-Klass formula, which measures market volatility based on the relationship between the open, high, low, and close prices.
- The result is further smoothed by the ALMA filter, delivering a highly stable representation of market volatility that is resilient against market noise.
4. Z-Score and Probability Estimation (Statistics):
- The script measures where the current price sits relative to the candle's midpoint and divides this by the calculated volatility. This creates a statistical value known as a Z-score.
- Using a built-in Cumulative Distribution Function for a normal distribution (normCDF via the error function erf), the script converts this score into a directional weight between 0 and 1. This weight represents the statistical probability of whether the move is inherently bullish or bearish.
5. Determining Final Power (Buy/Sell Power):
- If trading volume data is available for the asset, the script multiplies the volume by this calculated statistical weight.
- If volume data is unavailable (e.g., on certain indices or Forex pairs), the script relies entirely on the mathematical structure of the price action itself (hence the dynamic text update to GK Price).
- These accumulated values over the specified period (e.g., 5 candles) are then converted into percentages (e.g., BUY: 65.0% / SELL: 35.0%).
6. Chart Visualization:
- A text label is generated on the right side of the chart, shifted forward by a user-defined offset (3 candles by default).
- This label smoothly changes color (gradient) depending on who is dominating the market. If buyers have the upper hand, the label turns green (or your custom bullish color). If sellers take control, it turns red. It remains gray when the market is in balance.
Key Advantages of This Script:
- Versatility: It functions seamlessly both on markets with volume data (crypto, stocks) and markets without it (forex).
- Statistical Framework: Rather than guessing a trend based on simple logic like "the price is going up, so buy," it evaluates mathematical probability and volatility.
Conclusion – Overall, this is a dynamic indicator that utilizes mathematical estimations (Garman-Klass volatility, statistical Z-score, and probability distribution) to estimate the power of buyers and sellers over a selected candle lookback period.Typically, similar indicators fetch data from lower timeframes and rely on a simple logic: a red candle means a drop where sellers won, while a green candle means a rise where buyers won. They then simply aggregate the data and determine the buy/sell power based on the ratio of bullish to bearish candles.This indicator, however, attempts to reconstruct those same relationships mathematically on a single timeframe.Soon, I will release an oscillator that will serve as a historical complement to this indicator.
Catatan Rilis
Code refactoring incorporating additional modifications to improve the accuracy of Buy/Sell Power estimation—using only candle OHLCV data—along with added safeguards suitable for any market or asset class.The recommended minimum timeframe is 5 minutes for stocks, forex, commodities, and crypto; at lower timeframes (below 3 minutes), the indicator lacks sufficient data.
Catatan Rilis
New calculation engine – a full GKYZ estimator calculating candlestick volatility based on OHLCV – other changes are minor; the indicator is more accurate; recommended base/default period length is 7.GKYZ Hybrid Volatility (Garman-Klass-Yang-Zhang):
The script calculates volatility based on Open, High, Low, Close prices, and overnight gaps. This provides a much more accurate picture of actual price fluctuations than standard ATR or simple standard deviation.
Kaufman Efficiency Ratio (VW-ER) with Volume Filter:
Measures how efficiently the price moves in a given direction relative to volume. It dynamically weighs the relationship between inter-bar and intra-bar momentum.
Wyckoff Volume Flow Engine:
Analyzes the relationship between the volume z-score and the candle spread z-score. It allows for the detection of volume anomalies (e.g., situations where a huge effort in terms of massive volume does not translate into a proportional price movement).
MCDF Normalization (Normal CDF & erf):
Uses an error function (erf) implementation to calculate the normal cumulative distribution function (normCDF), which reliably transforms price imbalance into a probabilistic indicator of supply and demand strength.
Trend Strength Index (S-TR) and Final Label:
On the last bar of the chart, it generates a clear information label containing:
BUY / SELL (%) – Percentage distribution of buyer and seller strength.
STR – Trend strength on a scale from -100% to +100%.
🔥 ANOMALY – A warning indicating unusual volume activity has been detected.
Catatan Rilis
The Label has been expanded with additional information – modernized to work with the C-Power Osc Pro indicator. The indicator works exclusively on the OHLC-V candlestick, without collecting data from lower intervals (hence the extensive "candlestick reading" section).Key Dashboard Metrics Explained
• S-TR (Strength of Trend):
• What it represents: The pure structural momentum and efficiency of the directional trend over the selected lookback window (candlePeriod).
• How it works: It takes the Kaufman Efficiency Ratio and multiplies it by the mathematical sign (+ or -) of the net volume-weighted price change. A positive value (e.g., +45.0%) means buyers are efficiently driving the trend upward with clean structure. A negative value means sellers are in efficient control. If this value is close to 0%, it indicates a highly inefficient, choppy, or rotating sideways market, regardless of candle size.
• W-Press (Wick Pressure):
• What it represents: The hidden intra-candle battle occurring at the extremes (the wicks), showing which side is aggressively rejecting price.
• How it works: It measures the exact mathematical spread between the upper wick and the lower wick relative to the total candle range. The indicator outputs a raw percentage and explicitly appends a tag showing the dominant pressure direction:
• Bear Pressure: Means the upper wick is larger than the lower wick (sellers are actively pushing price down from the highs).
• Bull Pressure: Means the lower wick is larger than the upper wick (buyers are aggressively stepping in and buying up the lows).
• Imbalance:
• What it represents: The microstructural disruption inside the candlestick body relative to the historical norm.
• How it works: It calculates a ratio comparing the candle's body size (open to close) directly against its total wick size. It then standardizes this ratio against an ALMA-smoothed historical baseline to project a Normalized Imbalance Percentage (0% to 100%). A high Imbalance percentage (e.g., >75%) indicates that the candle body completely overpowered the wicks, signaling massive institutional order execution with very little order-matching or two-way friction.
Module-by-Module Engine Breakdown
1. Volume Filtering & Adaptive Smoothing
• What it does: It prevents massive, single-second volume anomalies (like news spikes) from breaking the indicator's core mathematical logic.
• How it works: It sets a dynamic volume ceiling using an Arnaud Legoux Moving Average (ALMA) plus 4 standard deviations. Any volume reading breaching this threshold is automatically clamped down to ensure statistical consistency in volatile conditions.
2. GKYZ Hybrid Volatility Engine
• What it does: It calculates a continuous, highly precise, log-normal localized volatility percentage (finalVolatilityPct).
• How it works: It blends the Garman-Klass (GK) and Rogers-Satchell (RS) variance models. It mathematically tracks the logarithmic relationship of overnight gaps alongside intraday high, low, open, and close ratios, smoothing the output via ALMA.
3. Efficiency Ratio & Fisher Scaling
• What it does: It measures market efficiency versus noise to dynamically scale internal algorithmic weights.
• How it works: It uses the volume-weighted Kaufman Efficiency Ratio. If price action is moving cleanly in one direction, the score approaches 1. If it is choppy, it drops toward 0. This score is passed through a hyperbolic tangent function (f_tanh) to dynamically balance the log weight properties.
4. 2D Mahalanobis Distance (Wyckoff Anomaly Engine)
• What it does: It continuously scans the tape for classic Wyckoff Effort vs. Result structural anomalies.
• How it works: It maps both volume Z-scores and candle spread Z-scores onto a 2D statistical matrix. By measuring the Mahalanobis Distance between them, it uncovers hidden institutional footprints—such as when extreme volume (high effort) fails to move the price significantly (low result), indicating hidden absorption.
5. Macro Aggregation & Power Balancing
• What it does: It isolates the exact macro balance of market control between buying and selling volume.
• How it works: Using a Cumulative Distribution Function (normCDF) mapped against price imbalances, it calculates a directional probability weight. This weight is multiplied by the processed volume and aggregated over the lookback period to establish the final BUY % and SELL % split.
6. Dynamic Point of Control (POC Centroid)
• What it does: It calculates the fair price gravity center inside each individual candlestick, mirroring a footprint chart's Point of Control (POC).
• How it works: It assesses the interaction between wick asymmetry, close positioning, and price momentum. It applies a parabolic shifting factor to plot a precise inner-candle equilibrium price point, displayed directly on your chart as a tiny dot (●).
7. Statistical Pattern Engine
• What it does: It reads the current market context and prints highly descriptive, actionable trading signals.
• How it works: By ranking speed and wick distribution metrics into statistical percentiles, it instantly triggers one of four states: Algo Expans (strong breakout momentum), Liquid Sweep (stop hunts rejecting past the centroid), or Absorp Traps (failed breakouts encountering massive resting counter-orders).
8. Quantized Output Display
• What it does: It cleans up the raw numerical data and displays a scannable dashboard next to the current price candle.
• How it works: All data outputs are passed through a final smoothing filter and quantized (rounded to strict 2.5% steps) to remove mathematical noise. The label automatically shifts and fades along a dynamic color gradient from grey to deep green (bullish conviction) or deep red (bearish conviction).
Catatan Rilis
Added an option to disable certain label messages – resizing.
Pernyataan Penyangkalan
Informasi dan publikasi ini tidak dimaksudkan, dan bukan merupakan, saran atau rekomendasi keuangan, investasi, trading, atau jenis lainnya yang diberikan atau didukung oleh TradingView. Baca selengkapnya di Ketentuan Penggunaan.
Pernyataan Penyangkalan
Informasi dan publikasi ini tidak dimaksudkan, dan bukan merupakan, saran atau rekomendasi keuangan, investasi, trading, atau jenis lainnya yang diberikan atau didukung oleh TradingView. Baca selengkapnya di Ketentuan Penggunaan.