Diupdate
$$$ GAP DIGGA $$$
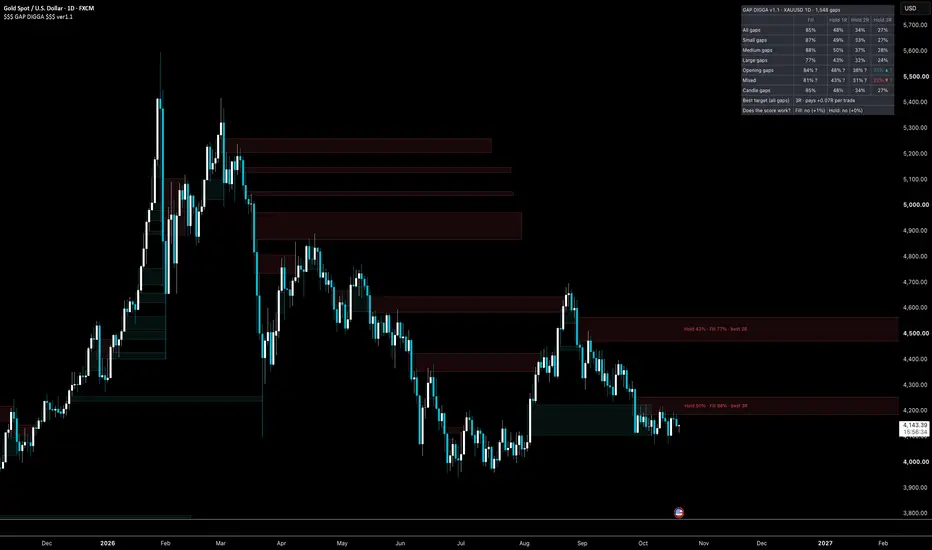
$$$ GAP DIGGA $$$ v1.0
A fair value gap indicator that tells you which gaps have actually worked on your chart — and which ones you should stop waiting for.
Every FVG tool draws every gap the same way. A gap that fills and disappears looks exactly like a gap that holds and starts a move. You find out which one you had after it is over. GAP DIGGA keeps track. It watches every gap it draws, remembers what happened to it, and uses that memory to rate the next one. No opinions, no hand-picked weights, just what your chart has done.
What it does
For every gap, it asks two questions and answers them with numbers from your chart's own history:
Will it fill? How often gaps like this one got filled within a set number of bars.
Will it hold? How often a trade taken from gaps like this one worked: a limit order halfway into the gap, a stop just past the move that created it, and a target at one, two or three times the risk. You see all three, and the label tells you which target has paid best from gaps like this.
"Gaps like this one" means two things: how big the gap is, and how it was made. That second one matters more than you would think, and we will get to it.
Reading the label
Hold 48% · Fill 85% · best 1R
Gaps like this one held 48% of the time, filled 85% of the time, and the target that paid best from them was 1R. A "?" at the end means there are not many similar gaps yet, so take it lightly. The box itself is shaded by the Hold number — solid when gaps like it have held well, faint when they have not — so you can see the best gap on the chart without reading anything. When the chart has almost no history, the label says "warming up" in grey. It will not guess.
Math made easy
Statistics are only useful if you can read them at a glance, so the panel speaks in four symbols and nothing else:
▲ or ▼ — this kind of gap does clearly better, or clearly worse, than the average gap on this chart.
▲▲ or ▼▼ — much better, or much worse.
nothing — it is the average with a different name. Ignore the row.
? — fewer than 50 gaps behind this number. Wait for more before you believe it.
Every number is a plain percentage of what happened. No decimals, no counts, no ranges. If you want those, there is a Detailed view in the settings, explained at the end.
Reading the stats panel
One table, read top to bottom.
The title says the symbol, the timeframe and how many gaps it has counted so far.
Four columns: Fill, Hold 1R, Hold 2R, Hold 3R. Fill is "did price come back and cover the gap". The three Hold columns are the same trade with three different targets — one, two and three times the risk.
All gaps is the plain average. Everything below it is compared to this row.
Small, Medium, Large gaps split them by height relative to recent volatility.
Opening gaps, Mixed, Candle gaps split them by how they were made. An opening gap appeared between two candles — overnight, over the weekend — with no candle actually making the move. A candle gap was made by one candle's move, the whole gap sits inside it. Mixed is in between. This is the row that changes everything on higher timeframes.
Best target (all gaps) says which target has paid best for the average gap — every gap on the chart, the bad ones included — and whether it made money, broke even or lost.
Does the score work? is the one line that tells you how much to believe the rest. Every gap is scored the moment it appears, from gaps that had already played out; when it plays out too, the tool compares what it said with what happened. "Yes" means the scores have been right. "No" means they are just the average — trade that instead and ignore the shading. "Overconfident" means the scores have promised more than they delivered.
The ranking panel, a second toggle, lists the open gaps from best to worst, with how far each is from the current price. For when there are six boxes on the chart and you want to know which one to wait for.
What it found, and where it helps
We ran it on gold, GBPNZD, AUDUSD and NAS100 before publishing. The same picture came back everywhere, and it changes how you should use gaps.
On lower timeframes (5m to 1h), gaps are all the same. Big or small, in trend or against it, roughly half of them hold and the rest do not. On gold 15m, 3,200 gaps: 85% filled, 48% held at 1R, and no type of gap did better than any other. The tool's own skill check reads zero. This is the honest answer most FVG tools will not give you: intraday, there is no such thing as a "high quality" gap. Use GAP DIGGA here as a filter for your expectations, not as a signal — if you trade intraday gaps, know that the gap itself is a coin flip and your edge has to come from somewhere else.
On higher timeframes (4h, daily), it gets interesting. Most daily gaps are not made by a candle at all. They are made overnight or over the weekend — price simply opens somewhere else. On daily gold, that is 73% of all gaps. Those opening gaps fill 82% of the time and hold only 22%. They are targets, not support. The gaps that a real candle made — the ones where the middle bar covers the whole gap — hold 48% at 1R and 27% at 3R, more than double. GAP DIGGA tells the two apart with a "made by" tag, and on daily gold its skill check reads +7%, with its predictions landing within a point of what happened across 5,000 gaps.
So: on the daily, use it to know which gaps to expect price to run through and which ones might actually hold. On the 15m, use it to stop hoping.
How to use it
1. Add it to any chart. It works on any symbol.
2. Scroll left once so the chart loads its history. The more history, the better the numbers.
3. Read the box shading for a quick look, the label for the numbers.
4. Turn on the stats panel once per chart and look at the skill number at the bottom. That tells you how much to believe the rest.
5. Set the two alerts if you like: a new gap with a good score, and price touching one.
A few honest notes
The numbers come from your chart's loaded history, so a chart with a year of data gives a better picture than one with a month. Gaps that happen close together are not really separate events, so the ranges shown are a little narrower than the truth. The trade math ignores spread and commission. And a score is what has happened, not what will — a gap that held 48% of the time in the past is a gap with no edge, and the tool will tell you exactly that.
For the detailed view
Switch the panel to Detailed in the settings and the same table shows its working. Each cell becomes "22% ×0.77 n=3728": the percentage, how many times the average it is, and how many gaps it came from. The All gaps row adds a range, "48% [47-50]": the true number is somewhere in there, and the range narrows as the count grows. A Calibration block replaces the one-line verdict: gaps grouped by the score they were given, with the average score ("pred") next to what actually happened ("obs"), and a skill number at the bottom — above zero the scores help, around zero they are the average, below zero raise k in the settings. The label gains the trade's expected result per unit of risk and the smallest count behind it.
Important
This tool is a technical assistant, not a financial advisor. It is designed for traders who understand technical analysis. A score is a measured frequency in past data, not a forecast. Comprehensive market knowledge and independent validation are required before making any trading decision. PINE DIGGA Indicators shall not be held liable for any trading losses or financial damages.
© PINEDIGGA - 2026
A fair value gap indicator that tells you which gaps have actually worked on your chart — and which ones you should stop waiting for.
Every FVG tool draws every gap the same way. A gap that fills and disappears looks exactly like a gap that holds and starts a move. You find out which one you had after it is over. GAP DIGGA keeps track. It watches every gap it draws, remembers what happened to it, and uses that memory to rate the next one. No opinions, no hand-picked weights, just what your chart has done.
What it does
For every gap, it asks two questions and answers them with numbers from your chart's own history:
Will it fill? How often gaps like this one got filled within a set number of bars.
Will it hold? How often a trade taken from gaps like this one worked: a limit order halfway into the gap, a stop just past the move that created it, and a target at one, two or three times the risk. You see all three, and the label tells you which target has paid best from gaps like this.
"Gaps like this one" means two things: how big the gap is, and how it was made. That second one matters more than you would think, and we will get to it.
Reading the label
Hold 48% · Fill 85% · best 1R
Gaps like this one held 48% of the time, filled 85% of the time, and the target that paid best from them was 1R. A "?" at the end means there are not many similar gaps yet, so take it lightly. The box itself is shaded by the Hold number — solid when gaps like it have held well, faint when they have not — so you can see the best gap on the chart without reading anything. When the chart has almost no history, the label says "warming up" in grey. It will not guess.
Math made easy
Statistics are only useful if you can read them at a glance, so the panel speaks in four symbols and nothing else:
▲ or ▼ — this kind of gap does clearly better, or clearly worse, than the average gap on this chart.
▲▲ or ▼▼ — much better, or much worse.
nothing — it is the average with a different name. Ignore the row.
? — fewer than 50 gaps behind this number. Wait for more before you believe it.
Every number is a plain percentage of what happened. No decimals, no counts, no ranges. If you want those, there is a Detailed view in the settings, explained at the end.
Reading the stats panel
One table, read top to bottom.
The title says the symbol, the timeframe and how many gaps it has counted so far.
Four columns: Fill, Hold 1R, Hold 2R, Hold 3R. Fill is "did price come back and cover the gap". The three Hold columns are the same trade with three different targets — one, two and three times the risk.
All gaps is the plain average. Everything below it is compared to this row.
Small, Medium, Large gaps split them by height relative to recent volatility.
Opening gaps, Mixed, Candle gaps split them by how they were made. An opening gap appeared between two candles — overnight, over the weekend — with no candle actually making the move. A candle gap was made by one candle's move, the whole gap sits inside it. Mixed is in between. This is the row that changes everything on higher timeframes.
Best target (all gaps) says which target has paid best for the average gap — every gap on the chart, the bad ones included — and whether it made money, broke even or lost.
Does the score work? is the one line that tells you how much to believe the rest. Every gap is scored the moment it appears, from gaps that had already played out; when it plays out too, the tool compares what it said with what happened. "Yes" means the scores have been right. "No" means they are just the average — trade that instead and ignore the shading. "Overconfident" means the scores have promised more than they delivered.
The ranking panel, a second toggle, lists the open gaps from best to worst, with how far each is from the current price. For when there are six boxes on the chart and you want to know which one to wait for.
What it found, and where it helps
We ran it on gold, GBPNZD, AUDUSD and NAS100 before publishing. The same picture came back everywhere, and it changes how you should use gaps.
On lower timeframes (5m to 1h), gaps are all the same. Big or small, in trend or against it, roughly half of them hold and the rest do not. On gold 15m, 3,200 gaps: 85% filled, 48% held at 1R, and no type of gap did better than any other. The tool's own skill check reads zero. This is the honest answer most FVG tools will not give you: intraday, there is no such thing as a "high quality" gap. Use GAP DIGGA here as a filter for your expectations, not as a signal — if you trade intraday gaps, know that the gap itself is a coin flip and your edge has to come from somewhere else.
On higher timeframes (4h, daily), it gets interesting. Most daily gaps are not made by a candle at all. They are made overnight or over the weekend — price simply opens somewhere else. On daily gold, that is 73% of all gaps. Those opening gaps fill 82% of the time and hold only 22%. They are targets, not support. The gaps that a real candle made — the ones where the middle bar covers the whole gap — hold 48% at 1R and 27% at 3R, more than double. GAP DIGGA tells the two apart with a "made by" tag, and on daily gold its skill check reads +7%, with its predictions landing within a point of what happened across 5,000 gaps.
So: on the daily, use it to know which gaps to expect price to run through and which ones might actually hold. On the 15m, use it to stop hoping.
How to use it
1. Add it to any chart. It works on any symbol.
2. Scroll left once so the chart loads its history. The more history, the better the numbers.
3. Read the box shading for a quick look, the label for the numbers.
4. Turn on the stats panel once per chart and look at the skill number at the bottom. That tells you how much to believe the rest.
5. Set the two alerts if you like: a new gap with a good score, and price touching one.
A few honest notes
The numbers come from your chart's loaded history, so a chart with a year of data gives a better picture than one with a month. Gaps that happen close together are not really separate events, so the ranges shown are a little narrower than the truth. The trade math ignores spread and commission. And a score is what has happened, not what will — a gap that held 48% of the time in the past is a gap with no edge, and the tool will tell you exactly that.
For the detailed view
Switch the panel to Detailed in the settings and the same table shows its working. Each cell becomes "22% ×0.77 n=3728": the percentage, how many times the average it is, and how many gaps it came from. The All gaps row adds a range, "48% [47-50]": the true number is somewhere in there, and the range narrows as the count grows. A Calibration block replaces the one-line verdict: gaps grouped by the score they were given, with the average score ("pred") next to what actually happened ("obs"), and a skill number at the bottom — above zero the scores help, around zero they are the average, below zero raise k in the settings. The label gains the trade's expected result per unit of risk and the smallest count behind it.
Important
This tool is a technical assistant, not a financial advisor. It is designed for traders who understand technical analysis. A score is a measured frequency in past data, not a forecast. Comprehensive market knowledge and independent validation are required before making any trading decision. PINE DIGGA Indicators shall not be held liable for any trading losses or financial damages.
© PINEDIGGA - 2026
Catatan Rilis
--- Inputs now are hidden from the top left indicator list. Catatan Rilis
v1.1 — no more fake gaps from single-price barsFIXED — gaps made of bars with no range are skipped.
Some feeds start their history decades back with single-price bars: one price per day, high equal to low. FXCM's daily gold is one of them, back to the 1970s. Between two such dots every move looks like a three-candle gap that the middle candle cannot cover, so v1.0 counted thousands of them as opening gaps. On daily gold they outnumbered the real gaps and made the panel say that opening gaps rarely hold and candle gaps hold twice as often. That came from the data, not from gaps. v1.1 records a gap only when all three of its candles have a range.
Measured before shipping. On charts with real bars nothing changes: gold 15m, FXCM daily gold 2021-26 and micro gold futures daily give the same gaps and the same counts as v1.0, gap for gap. On a test history of single-price bars followed by normal ones, v1.0 found 6,076 gaps (94% "opening") and v1.1 found 362 (0%).
Corrected in the description. The daily finding of v1.0 is withdrawn. A second test was added: every gold 15m gap compared with plain levels of the same size, distance and stop. Fill is the same, 85-87% for both. Hold at 1R is 47-48% for gaps and 45-48% for plain levels. A gap is a slightly better level than a random one, not an edge.
One thing to do after updating. Recreate your alerts. An existing alert keeps running the v1.0 snapshot.

PINE DIGGA · Measured indicators for gold, crypto and the Nasdaq · pinedigga.com
Pernyataan Penyangkalan
Informasi dan publikasi ini tidak dimaksudkan, dan bukan merupakan, saran atau rekomendasi keuangan, investasi, trading, atau jenis lainnya yang diberikan atau didukung oleh TradingView. Baca selengkapnya di Ketentuan Penggunaan.
PINE DIGGA · Measured indicators for gold, crypto and the Nasdaq · pinedigga.com
Pernyataan Penyangkalan
Informasi dan publikasi ini tidak dimaksudkan, dan bukan merupakan, saran atau rekomendasi keuangan, investasi, trading, atau jenis lainnya yang diberikan atau didukung oleh TradingView. Baca selengkapnya di Ketentuan Penggunaan.