OPEN-SOURCE SCRIPT
Footprint X-Ray [BOSWaves]
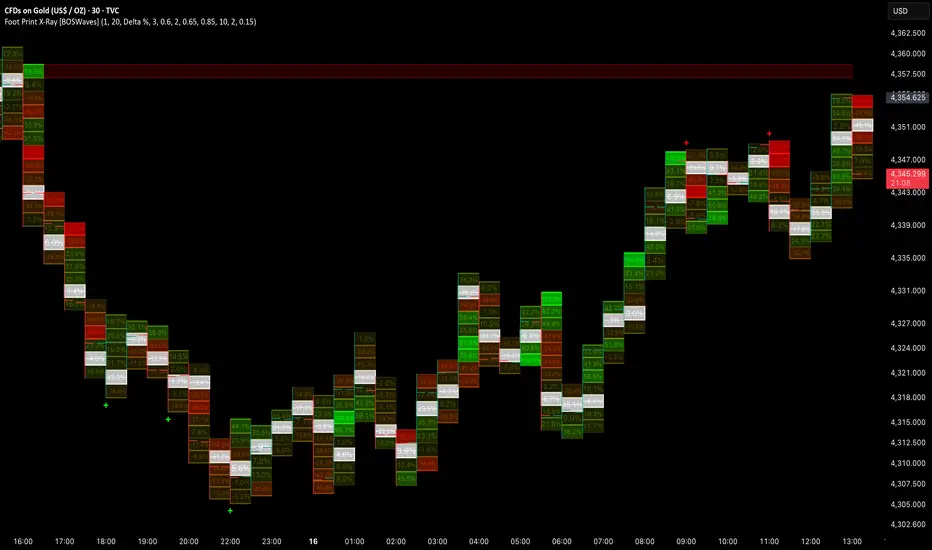
Footprint X-Ray [BOSWaves] - Intrabar Delta Decomposition with Stacked Imbalance, Absorption, and Unfinished Business Detection
Overview
Footprint X-Ray [BOSWaves] is an intrabar order flow decomposition system that reconstructs the buy and sell volume distribution within each bar by pulling lower timeframe data and mapping participation to price rows, where row coloring, POC identification, stacked imbalance detection, and signal generation are driven by actual delta ratios at each price level rather than bar-level approximations or close-position estimates.

Instead of treating each bar as a single undifferentiated unit of buying or selling pressure, the indicator divides each bar's price range into rows sized relative to ATR, assigns lower timeframe bar volume to each row based on price overlap, and derives a per-row delta ratio that reflects whether buying or selling dominated at each specific price level within the bar. This creates a full participation map inside every candle showing not just what direction the bar moved but where within the bar each side was in control.
This creates an order flow framework that reveals the internal structure of price action invisible on a standard candlestick chart. The footprint cells expose per-level delta composition, the POC identifies the price row with the greatest participation, stacked imbalances highlight consecutive rows with dominant one-sided flow indicating aggressive institutional activity, absorption signals detect when extreme rows show opposing flow against the bar direction, and unfinished business zones project forward from bars where one side was entirely absent at the extreme, marking locations where price is statistically likely to return to complete the auction.
Price is therefore evaluated not at the bar level but at the price row level, exposing order flow dynamics that standard indicators cannot access.
Conceptual Framework
Footprint X-Ray is founded on the principle that the most actionable order flow information lives inside individual bars rather than across them, and that understanding which specific price levels within a bar attracted aggressive buying or selling reveals institutional positioning fingerprints that bar-level indicators systematically obscure.
Standard order flow approaches measure directional commitment at the bar level through delta, volume, or close positioning, but these metrics collapse the internal price distribution into a single reading that loses the structural detail of where within the bar each side dominated. This framework recovers that internal structure by reconstructing per-row participation from lower timeframe data, exposing the distribution of buying and selling pressure across the full price range of every bar.
Three core principles guide the design:
This shifts order flow analysis from bar-level delta measurement into per-row intrabar participation mapping where structural footprint patterns expose institutional activity with precision unavailable at the candlestick level.
Theoretical Foundation
The indicator combines lower timeframe OHLCV data retrieval, price overlap-weighted volume allocation to ATR-derived price rows, per-row delta ratio calculation, POC identification by maximum row volume, consecutive dominance run detection for stacked imbalances, extreme row opposing flow detection for absorption, and one-sided extreme row detection for unfinished business zone projection.
Lower timeframe bars are retrieved using security_lower_tf and each lower timeframe bar's volume is allocated to price rows proportionally based on the overlap between the lower timeframe bar's range and each row's boundaries. Bullish lower timeframe bars contribute their allocated volume to buy volume and bearish bars to sell volume, with doji bars split equally. CVD from TradingView's volume delta library provides the bar-level delta for divergence and exhaustion detection. Row size is automatically derived as a fraction of the 200-bar ATR, scaling the footprint granularity to the instrument's typical volatility.
Four internal systems operate in tandem:
This design provides a complete intrabar participation map with structural pattern detection across every dimension of order flow that is reconstructable from OHLCV data.
How It Works
Footprint X-Ray evaluates price through a sequence of intrabar decomposition and pattern detection processes:
Together, these elements form a continuously updating intrabar participation map where cell coloring reveals per-level delta composition, structural pattern detection identifies institutional activity signatures, and forward-projecting zones maintain active auction completion references.
Interpretation
Footprint X-Ray should be interpreted as an intrabar order flow decomposition system with layered structural pattern detection:
Per-row delta composition, POC location, stacked imbalance presence, absorption signals, unfinished business zones, and exhaustion bars collectively provide more order flow intelligence than any element in isolation.
Signal Logic & Visual Cues
Footprint X-Ray presents five distinct signal types derived from intrabar participation analysis:
Unfinished business zones provide continuous passive signal context by projecting forward from incomplete auction extremes until price returns to complete the participation sequence.
Alert generation covers bullish and bearish CVD flips, bullish and bearish absorption events, bullish and bearish delta divergence, and exhaustion bar detection for comprehensive systematic order flow monitoring.
Strategy Integration
Footprint X-Ray fits within institutional order flow and auction theory-based trading approaches:
Technical Implementation Details
Optimal Application Parameters
Timeframe Guidance:
Suggested Baseline Configuration:
These suggested parameters should be used as a baseline; their effectiveness depends on the instrument's volume characteristics, typical bar range, and preferred signal sensitivity, so fine-tuning is expected for optimal performance.
Parameter Calibration Notes
Use the following adjustments to refine behavior without altering the core logic:
Adjustments should be incremental and evaluated across multiple session types rather than isolated market conditions.
Performance Characteristics
High Effectiveness:
Reduced Effectiveness:
Integration Guidelines
Disclaimer
Footprint X-Ray [BOSWaves] is a professional-grade intrabar order flow decomposition and institutional activity detection tool. It uses lower timeframe volume allocation with per-row delta calculation but does not access true exchange-level bid and ask data. All participation measurements are reconstructed from OHLCV data and represent best-approximation estimates rather than actual order book information. Results depend on instrument liquidity, lower timeframe data availability, parameter selection, and disciplined execution. BOSWaves recommends deploying this indicator within a broader analytical framework that incorporates price structure, trend context, and comprehensive risk management.
Overview
Footprint X-Ray [BOSWaves] is an intrabar order flow decomposition system that reconstructs the buy and sell volume distribution within each bar by pulling lower timeframe data and mapping participation to price rows, where row coloring, POC identification, stacked imbalance detection, and signal generation are driven by actual delta ratios at each price level rather than bar-level approximations or close-position estimates.
Instead of treating each bar as a single undifferentiated unit of buying or selling pressure, the indicator divides each bar's price range into rows sized relative to ATR, assigns lower timeframe bar volume to each row based on price overlap, and derives a per-row delta ratio that reflects whether buying or selling dominated at each specific price level within the bar. This creates a full participation map inside every candle showing not just what direction the bar moved but where within the bar each side was in control.
This creates an order flow framework that reveals the internal structure of price action invisible on a standard candlestick chart. The footprint cells expose per-level delta composition, the POC identifies the price row with the greatest participation, stacked imbalances highlight consecutive rows with dominant one-sided flow indicating aggressive institutional activity, absorption signals detect when extreme rows show opposing flow against the bar direction, and unfinished business zones project forward from bars where one side was entirely absent at the extreme, marking locations where price is statistically likely to return to complete the auction.
Price is therefore evaluated not at the bar level but at the price row level, exposing order flow dynamics that standard indicators cannot access.
Conceptual Framework
Footprint X-Ray is founded on the principle that the most actionable order flow information lives inside individual bars rather than across them, and that understanding which specific price levels within a bar attracted aggressive buying or selling reveals institutional positioning fingerprints that bar-level indicators systematically obscure.
Standard order flow approaches measure directional commitment at the bar level through delta, volume, or close positioning, but these metrics collapse the internal price distribution into a single reading that loses the structural detail of where within the bar each side dominated. This framework recovers that internal structure by reconstructing per-row participation from lower timeframe data, exposing the distribution of buying and selling pressure across the full price range of every bar.
Three core principles guide the design:
- Each price row within a bar should have its own buy and sell volume measurement derived from lower timeframe participation overlap, providing per-level delta ratios rather than bar-level approximations.
- Structural patterns within the footprint, specifically stacked consecutive dominant rows and opposing flow at extremes, carry meaningful institutional activity signals that justify dedicated detection and visualization separate from raw row coloring.
- Unfinished auction levels where one side was entirely absent at a bar extreme should be projected forward as active reference zones until price returns to complete the participation, as incomplete auctions represent the highest-probability reversion targets within the footprint framework.
This shifts order flow analysis from bar-level delta measurement into per-row intrabar participation mapping where structural footprint patterns expose institutional activity with precision unavailable at the candlestick level.
Theoretical Foundation
The indicator combines lower timeframe OHLCV data retrieval, price overlap-weighted volume allocation to ATR-derived price rows, per-row delta ratio calculation, POC identification by maximum row volume, consecutive dominance run detection for stacked imbalances, extreme row opposing flow detection for absorption, and one-sided extreme row detection for unfinished business zone projection.
Lower timeframe bars are retrieved using security_lower_tf and each lower timeframe bar's volume is allocated to price rows proportionally based on the overlap between the lower timeframe bar's range and each row's boundaries. Bullish lower timeframe bars contribute their allocated volume to buy volume and bearish bars to sell volume, with doji bars split equally. CVD from TradingView's volume delta library provides the bar-level delta for divergence and exhaustion detection. Row size is automatically derived as a fraction of the 200-bar ATR, scaling the footprint granularity to the instrument's typical volatility.
Four internal systems operate in tandem:
- Row Construction and Delta Allocation Engine: Divides each bar's price range into ATR-scaled rows, iterates through all lower timeframe bars within the current chart bar, allocates volume to overlapping rows by price range fraction, and derives per-row buy volume, sell volume, total volume, and delta ratio.
- Footprint Analysis System: Identifies the POC as the row with maximum total volume, runs consecutive dominance detection in both bull and bear directions to classify stacked imbalance rows, and evaluates extreme rows for absorption by testing opposing side dominance against the configured threshold.
- Unfinished Business Zone Engine: Tests the top and bottom rows of each bar for single-sided extreme dominance, creates forward-projecting zone boxes from qualifying rows, extends those zones rightward on each subsequent bar, and removes them when price midpoint is revisited.
- Signal Detection System: Derives bar delta from the CVD series, tests for delta divergence against recent price highs and lows, and identifies exhaustion bars where volume significantly exceeds the SMA baseline but net delta remains near zero, indicating a contested bar where neither side achieved directional resolution.
This design provides a complete intrabar participation map with structural pattern detection across every dimension of order flow that is reconstructable from OHLCV data.
How It Works
Footprint X-Ray evaluates price through a sequence of intrabar decomposition and pattern detection processes:
- Lower Timeframe Selection: The indicator automatically selects the most appropriate lower timeframe based on the current chart timeframe, using one-second for seconds charts, one-minute for intraday, five-minute for daily, and sixty-minute for higher timeframes, or the manually configured timeframe when auto selection is disabled.
- Row Size Calculation: The ATR over 200 bars multiplied by 0.1 and rounded to the minimum tick produces the row height, scaled automatically to the instrument's volatility. Manual row sizing overrides this when auto sizing is disabled.
- Lower Timeframe Data Retrieval: OHLCV arrays for the lower timeframe are retrieved via security_lower_tf and CVD is calculated using TradingView's volume delta library, providing both intrabar participation data and bar-level delta for signal detection.
- Row Initialization: The bar's price range is divided into rows of equal height, with the number of rows derived from the range divided by the row size.
- Volume Allocation per Row: For each row, all lower timeframe bars are iterated. Each lower timeframe bar contributing to a row has its volume allocated proportionally based on the fraction of its range overlapping the row boundary. Bullish lower timeframe bars contribute to buy volume and bearish bars to sell volume.
- Delta Ratio Calculation: Each row's delta ratio is calculated as buy volume minus sell volume divided by total volume, producing a normalized score from negative one to positive one that drives cell coloring.
- POC Identification: The row with the maximum total volume is identified as the Point of Control, receiving a distinct highlight color and an optional midpoint line.
- Stacked Imbalance Detection: Consecutive bullish dominant rows exceeding the configured threshold ratio are identified as bullish stacked imbalances. The same logic in reverse identifies bearish stacks. Qualifying rows receive highlighted border coloring.
- Absorption Detection: The top rows of green bars are tested for sell dominance and the bottom rows of red bars are tested for buy dominance. When opposing flow exceeds the absorption threshold at an extreme, an absorption signal is generated at the bar's high or low.
- Unfinished Business Zone Creation: The top row of each bar is tested for buy dominance above the UB threshold and the bottom row for sell dominance above the threshold. Qualifying extreme rows generate forward-projecting zone boxes that extend rightward until price revisits the zone midpoint.
- Delta Divergence Detection: Price making a new high within the lookback window while bar delta is negative generates a bearish divergence signal. Price making a new low while bar delta is positive generates a bullish divergence signal.
- Exhaustion Bar Detection: Bars with volume exceeding the SMA baseline multiplied by the volume multiplier and with absolute delta-to-volume ratio below the configured maximum qualify as exhaustion bars, indicating high participation without directional resolution.
- Candle Overlay Rendering: An optional transparent candle overlay with wicks colored by bar delta direction provides directional context on top of the footprint cell display without obscuring the underlying participation data.
Together, these elements form a continuously updating intrabar participation map where cell coloring reveals per-level delta composition, structural pattern detection identifies institutional activity signatures, and forward-projecting zones maintain active auction completion references.
Interpretation
Footprint X-Ray should be interpreted as an intrabar order flow decomposition system with layered structural pattern detection:
- Footprint Cells: Each colored box represents a price row within the bar. Green shading indicates buy-dominant flow at that level, red shading indicates sell-dominant flow, and color intensity reflects the magnitude of the imbalance. Neutral rows with balanced participation appear at intermediate opacity.
- Cell Text (Delta %): The percentage displayed in each cell represents the net delta ratio for that row, quantifying how one-sided participation was at each specific price level within the bar.
- Cell Text (Volume): When volume mode is selected, each cell displays the net volume (buy minus sell) at that price row, providing absolute rather than relative participation data.
- Accent Lines: A bright horizontal line on the dominant edge of each row highlights the side with greater participation, providing a clean visual boundary that reinforces the directional reading of each cell without requiring the text to be read.
- POC Row: The row with the highest total volume receives a distinct highlight and optional midpoint line, marking the price level with the greatest participation concentration within the bar and the most significant auction reference point.
- Stacked Imbalance Borders: Rows identified as part of a consecutive dominant run receive highlighted border coloring in the imbalance direction, signaling aggressive institutional one-sided flow across multiple consecutive price levels within the bar.
- Absorption Diamonds: Diamond markers below bars indicate bullish absorption where buyers dominated the bottom rows of a red bar, suggesting selling pressure was being absorbed by aggressive buyers. Diamonds above bars indicate bearish absorption where sellers dominated the top rows of a green bar.
- Unfinished Business Zones: Forward-projecting shaded boxes from extreme rows where one side was entirely absent mark incomplete auctions. Bullish UB zones project from bars where buyers dominated the top row without seller response. Bearish UB zones project from bars where sellers dominated the bottom row without buyer response.
- Delta Divergence Crosses: Cross markers below price on bullish divergences and above price on bearish divergences identify structural disagreement between price direction and bar delta, flagging hidden weakness at new highs and hidden strength at new lows.
- Exhaustion Circles: Orange circles on bars with extreme volume but near-zero net delta mark contested bars where neither side achieved resolution despite heavy participation, indicating potential inflection points where the prior directional move may be losing conviction.
- Delta Wicks: Optional candle overlay wicks colored by bar delta direction provide an immediate visual cue for whether net buying or net selling dominated the bar as a whole, complementing the per-row cell analysis.
Per-row delta composition, POC location, stacked imbalance presence, absorption signals, unfinished business zones, and exhaustion bars collectively provide more order flow intelligence than any element in isolation.
Signal Logic & Visual Cues
Footprint X-Ray presents five distinct signal types derived from intrabar participation analysis:
- Absorption Signal: Diamond markers generated when extreme rows show opposing flow against the bar direction, identifying institutional absorption of aggressive flow at price extremes.
- Delta Divergence Signal: Cross markers generated when price makes new highs or lows within the lookback window but bar delta contradicts the directional move, flagging structurally weak breakouts.
- Exhaustion Bar Signal: Orange circles generated on bars with exceptional volume and near-zero net delta, identifying participation battles where neither side achieved dominance despite heavy activity.
Unfinished business zones provide continuous passive signal context by projecting forward from incomplete auction extremes until price returns to complete the participation sequence.
Alert generation covers bullish and bearish CVD flips, bullish and bearish absorption events, bullish and bearish delta divergence, and exhaustion bar detection for comprehensive systematic order flow monitoring.
Strategy Integration
Footprint X-Ray fits within institutional order flow and auction theory-based trading approaches:
- POC Reaction Trading: Use POC rows as high-probability reference levels within each bar. The highest-volume row represents the price level most accepted by both buyers and sellers and frequently acts as intrabar support, resistance, or reversion anchor on subsequent price interaction.
- Stacked Imbalance Directional Bias: Use stacked imbalance detection as a directional conviction signal within bars. Consecutive buy-dominant rows from low to high indicate sustained aggressive buying across multiple price levels, suggesting institutional accumulation rather than isolated speculative activity.
- Absorption Reversal Framing: Use absorption signals as potential reversal triggers where aggressive flow is meeting organized opposing participation at extremes. Bullish absorption at the low of a red bar suggests buyers are defending price levels despite selling pressure, while bearish absorption at the high of a green bar suggests sellers are resisting upside extension.
- Unfinished Business Zone Targets: Use UB zones as reversion targets for subsequent price action, monitoring whether price returns to complete the auction at levels where one side was previously absent. The completion of an unfinished auction typically involves a return to the zone followed by the missing side finally participating.
- Divergence-Confirmed Entries: Use delta divergence signals as structural warning indicators rather than standalone entries, weighting them more heavily when they coincide with other confluence factors such as absorption or unfinished business zone proximity.
- Exhaustion Bar Context: Treat exhaustion bars as inflection point alerts requiring subsequent bar confirmation rather than immediate entry triggers. High volume with near-zero delta indicates a contested equilibrium that will resolve directionally on the following bars.
Technical Implementation Details
- Delta Source: TradingView volume delta library providing CVD series with automatic lower timeframe selection
- Row Construction: ATR-fraction row sizing with lower timeframe price overlap-weighted volume allocation per row
- Analysis Engine: Maximum volume POC identification, consecutive dominance run detection for stacked imbalances, and extreme row opposing flow testing for absorption
- UB System: Array-managed forward-projecting zone boxes with midpoint revisit detection and automatic removal
- Signal Detection: CVD-based delta divergence against lookback window highs and lows, volume SMA ratio combined with delta ratio for exhaustion classification
- Visualization: Gradient-colored footprint cells with accent lines, POC highlighting, stacked imbalance borders, absorption and divergence markers, exhaustion circles, UB zones, and optional delta wick candle overlay
- Performance Profile: Optimized with object count caps and array management for real-time execution across intraday and higher timeframes
Optimal Application Parameters
Timeframe Guidance:
- 1 - 5 min: Intrabar microstructure analysis for scalping with automatic one-minute lower timeframe providing high-resolution participation data within each chart bar
- 15 - 60 min: Session-level order flow decomposition for intraday trading with sufficient lower timeframe bar count per chart bar to produce meaningful row distributions
- 4H - Daily: Swing-level institutional footprint analysis with five-minute lower timeframe providing detailed participation mapping across larger price ranges
Suggested Baseline Configuration:
- Auto Lower Timeframe: Enabled
- Auto Row Size: Enabled
- Cell Text: Delta %
- Accent Lines: Enabled
- Highlight POC Row: Enabled
- Show Stacked Imbalances: Enabled
- Min Consecutive Rows: 3
- Dominance Threshold (SI): 0.60
- Show Absorption: Enabled
- Show Unfinished Business: Enabled
- Delta Divergence: Enabled
- Exhaustion Bars: Enabled
- Show Candle Overlay: Enabled
These suggested parameters should be used as a baseline; their effectiveness depends on the instrument's volume characteristics, typical bar range, and preferred signal sensitivity, so fine-tuning is expected for optimal performance.
Parameter Calibration Notes
Use the following adjustments to refine behavior without altering the core logic:
- Too few rows per bar: Disable Auto Row Size and manually reduce the row size value to increase row count, producing a more granular footprint with finer price level resolution for the target instrument and timeframe combination.
- Too many rows cluttering the display: Increase the manual row size or allow auto sizing to recalibrate. On higher timeframes with large bar ranges the automatic ATR fraction may produce excessive row counts that reduce readability.
- Stacked imbalance signals too frequent: Increase the Min Consecutive Rows setting to require longer dominance runs before stacking is classified, or increase the Dominance Threshold toward 0.75 to demand stronger per-row directional conviction.
- Absorption signals too frequent: Increase the Absorption Threshold toward 0.80 to require stronger opposing dominance at extremes before an absorption signal fires, filtering for only the most decisive institutional responses.
- Too many unfinished business zones: Increase the UB Dominance Threshold toward 0.90 to restrict zone creation to only the most extreme single-sided bar extremes, reducing zone density on the chart.
- Divergence signals firing too often: Increase the Divergence Lookback to require price to make a more significant new high or low before the divergence condition tests, reducing signal frequency to only the most structurally significant disagreements.
- Exhaustion signals too frequent: Increase the Volume Multiplier to require a larger volume spike above the baseline before exhaustion classification, or decrease the Max Delta Ratio to require closer to zero net delta for a bar to qualify.
Adjustments should be incremental and evaluated across multiple session types rather than isolated market conditions.
Performance Characteristics
High Effectiveness:
- Liquid instruments with consistent volume where lower timeframe bar allocation produces meaningful per-row participation distributions and reliable delta measurements
- Intraday and session-level timeframes where sufficient lower timeframe bars exist within each chart bar to produce statistically representative row-level volume allocation
- Order flow-based trading approaches where intrabar participation patterns provide entry confirmation or invalidation context that bar-level indicators cannot supply
- Institutional activity monitoring where stacked imbalances and absorption patterns reveal aggressive positioning that precedes significant directional moves
Reduced Effectiveness:
- Low-liquidity instruments where thin lower timeframe volume produces sparse row distributions with many empty cells and unreliable per-level delta ratios
- Higher timeframes on instruments without lower timeframe data availability where security_lower_tf returns insufficient bars per chart bar for meaningful decomposition
- Instruments without volume data, which the indicator detects and blocks with a runtime error
- Extremely fast markets during news events where lower timeframe bars are so large relative to the chart bar range that overlap allocation produces distorted row distributions
- Thin or extended-hours sessions where volume is too low to produce statistically meaningful per-row participation differences distinguishable from random distribution
Integration Guidelines
- Confluence: Combine with BOSWaves structural tools, trend indicators, or momentum oscillators to validate footprint-derived signals with broader analytical context before acting on intrabar participation patterns
- POC Context: Treat POC rows as the most significant intrabar reference levels. Subsequent price returning to a prior bar's POC is returning to its highest-participation level, which frequently acts as support, resistance, or magnetic reversion anchor.
- Stacked Imbalance Direction: Use stacked imbalance direction as a short-term institutional bias indicator. Consecutive buy-dominant rows from low to high suggest aggressive accumulation that may continue on subsequent bars. Consecutive sell-dominant rows suggest distribution.
- Unfinished Business Patience: Allow UB zones to be approached naturally rather than anticipating reactions immediately after formation. The auction completion process can take multiple bars and the zone should be monitored for participation behavior on arrival rather than treated as an automatic reversal level.
- Exhaustion Confirmation Requirement: Never treat exhaustion bars as standalone entry triggers. The exhaustion condition identifies a contested state that requires subsequent directional resolution. Wait for the following bar to confirm which side won the participation battle before acting on the exhaustion signal.
Disclaimer
Footprint X-Ray [BOSWaves] is a professional-grade intrabar order flow decomposition and institutional activity detection tool. It uses lower timeframe volume allocation with per-row delta calculation but does not access true exchange-level bid and ask data. All participation measurements are reconstructed from OHLCV data and represent best-approximation estimates rather than actual order book information. Results depend on instrument liquidity, lower timeframe data availability, parameter selection, and disciplined execution. BOSWaves recommends deploying this indicator within a broader analytical framework that incorporates price structure, trend context, and comprehensive risk management.
Skrip open-source
Dengan semangat TradingView yang sesungguhnya, pembuat skrip ini telah menjadikannya sebagai sumber terbuka, sehingga para trader dapat meninjau dan memverifikasi fungsinya. Salut untuk penulisnya! Meskipun Anda dapat menggunakannya secara gratis, perlu diingat bahwa penerbitan ulang kode ini tunduk pada Tata Tertib kami.

Pernyataan Penyangkalan
Informasi dan publikasi ini tidak dimaksudkan, dan bukan merupakan, saran atau rekomendasi keuangan, investasi, trading, atau jenis lainnya yang diberikan atau didukung oleh TradingView. Baca selengkapnya di Ketentuan Penggunaan.
Skrip open-source
Dengan semangat TradingView yang sesungguhnya, pembuat skrip ini telah menjadikannya sebagai sumber terbuka, sehingga para trader dapat meninjau dan memverifikasi fungsinya. Salut untuk penulisnya! Meskipun Anda dapat menggunakannya secara gratis, perlu diingat bahwa penerbitan ulang kode ini tunduk pada Tata Tertib kami.
Pernyataan Penyangkalan
Informasi dan publikasi ini tidak dimaksudkan, dan bukan merupakan, saran atau rekomendasi keuangan, investasi, trading, atau jenis lainnya yang diberikan atau didukung oleh TradingView. Baca selengkapnya di Ketentuan Penggunaan.