ChoCh Breakout Predictor
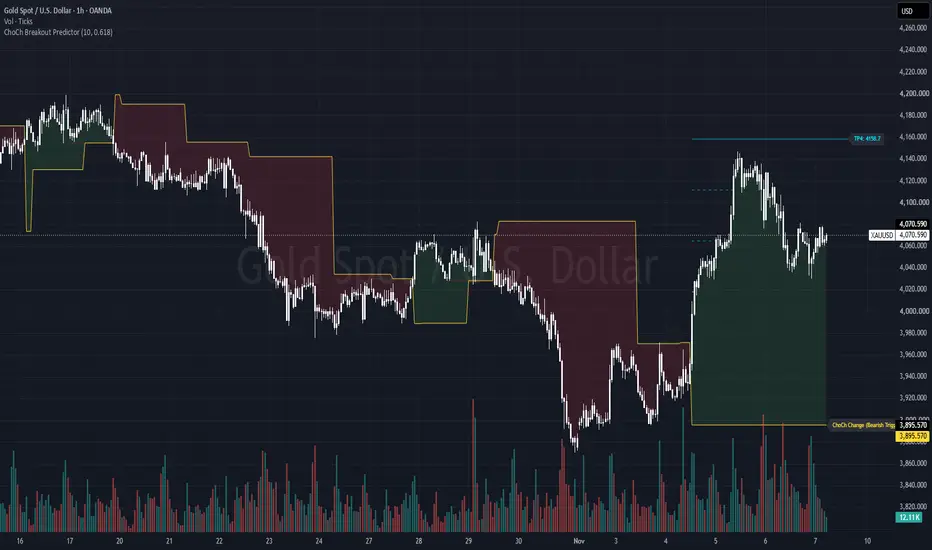
ChoCh Breakout Predictor is a technical analysis tool designed to identify market structure shifts (Change of Character / ChoCh) and automatically project dynamic profit targets based on structural volatility.
The indicator monitors pivot highs and lows to detect when price breaks established structural levels, signaling potential shifts in trend direction.
Core Features & Functionality
Market Structure & ChoCh Signals (Change of Character):
Bullish ChoCh: Triggered when price breaks and closes above the most recent defined pivot high, indicating a transition from bearish to bullish structure.
Bearish ChoCh: Triggered when price breaks and closes below the most recent defined pivot low, indicating a transition from bullish to bearish structure.
ChoCh events are marked directly on the chart with visual lines and labels.
Dynamic Profit Targets (Step-Up Fibonacci Targets):
Upon a ChoCh signal, the indicator calculates the structural range (the distance between the defining pivot high and pivot low).
An initial profit target (TP1) is projected at a distance equal to the structural range multiplied by a configurable Fibonacci step factor (default: 0.618).
Continuous Step-Up: As price reaches TP1, the target line converts to a dashed style, the text label is removed to maintain chart cleanliness, and the next target (TP2) is projected further in the trend direction. This process continues dynamically as long as the trend holds.
Structure Zone & Trigger Line:
Visual Cloud: Highlights the area between the current price and the active structural boundary (green for bullish zones, red for bearish zones).
ChoCh Trigger Line: Displays a clear, level-by-level line showing the exact price point required to trigger a market structure change.
Recommended Timeframes & Best Practices
Optimal Timeframe: 1-Hour (1H). The indicator is optimized to capture clear structural breaks on hourly charts, where noise is minimized, and pivot ranges provide reliable expansion targets.
Alternative Timeframes: Can be used on higher timeframes (4H) for macro structure analysis, or lower timeframes (15m) for execution when adjusting the Market Structure Length parameter.
Key Inputs
Market Structure Length: The lookback period required to confirm pivot highs and lows (Default: 10).
Fibonacci Step Multiplier: Controls the target distance expansion relative to the structural range (Default: 0.618).
Show Target Lines / Cloud: Toggle settings to enable or disable target projections and the background structure zone for a cleaner layout.
The indicator monitors pivot highs and lows to detect when price breaks established structural levels, signaling potential shifts in trend direction.
Core Features & Functionality
Market Structure & ChoCh Signals (Change of Character):
Bullish ChoCh: Triggered when price breaks and closes above the most recent defined pivot high, indicating a transition from bearish to bullish structure.
Bearish ChoCh: Triggered when price breaks and closes below the most recent defined pivot low, indicating a transition from bullish to bearish structure.
ChoCh events are marked directly on the chart with visual lines and labels.
Dynamic Profit Targets (Step-Up Fibonacci Targets):
Upon a ChoCh signal, the indicator calculates the structural range (the distance between the defining pivot high and pivot low).
An initial profit target (TP1) is projected at a distance equal to the structural range multiplied by a configurable Fibonacci step factor (default: 0.618).
Continuous Step-Up: As price reaches TP1, the target line converts to a dashed style, the text label is removed to maintain chart cleanliness, and the next target (TP2) is projected further in the trend direction. This process continues dynamically as long as the trend holds.
Structure Zone & Trigger Line:
Visual Cloud: Highlights the area between the current price and the active structural boundary (green for bullish zones, red for bearish zones).
ChoCh Trigger Line: Displays a clear, level-by-level line showing the exact price point required to trigger a market structure change.
Recommended Timeframes & Best Practices
Optimal Timeframe: 1-Hour (1H). The indicator is optimized to capture clear structural breaks on hourly charts, where noise is minimized, and pivot ranges provide reliable expansion targets.
Alternative Timeframes: Can be used on higher timeframes (4H) for macro structure analysis, or lower timeframes (15m) for execution when adjusting the Market Structure Length parameter.
Key Inputs
Market Structure Length: The lookback period required to confirm pivot highs and lows (Default: 10).
Fibonacci Step Multiplier: Controls the target distance expansion relative to the structural range (Default: 0.618).
Show Target Lines / Cloud: Toggle settings to enable or disable target projections and the background structure zone for a cleaner layout.

Pine Script v6 Developer & Trader (6 yrs exp.). Custom indicators, strategies & script upgrades to v6. DM me for project requests.
Pernyataan Penyangkalan
Informasi dan publikasi ini tidak dimaksudkan, dan bukan merupakan, saran atau rekomendasi keuangan, investasi, trading, atau jenis lainnya yang diberikan atau didukung oleh TradingView. Baca selengkapnya di Ketentuan Penggunaan.
Pine Script v6 Developer & Trader (6 yrs exp.). Custom indicators, strategies & script upgrades to v6. DM me for project requests.
Pernyataan Penyangkalan
Informasi dan publikasi ini tidak dimaksudkan, dan bukan merupakan, saran atau rekomendasi keuangan, investasi, trading, atau jenis lainnya yang diberikan atau didukung oleh TradingView. Baca selengkapnya di Ketentuan Penggunaan.