OPEN-SOURCE SCRIPT
[Kpt-Ahab] HeatMap Fusion
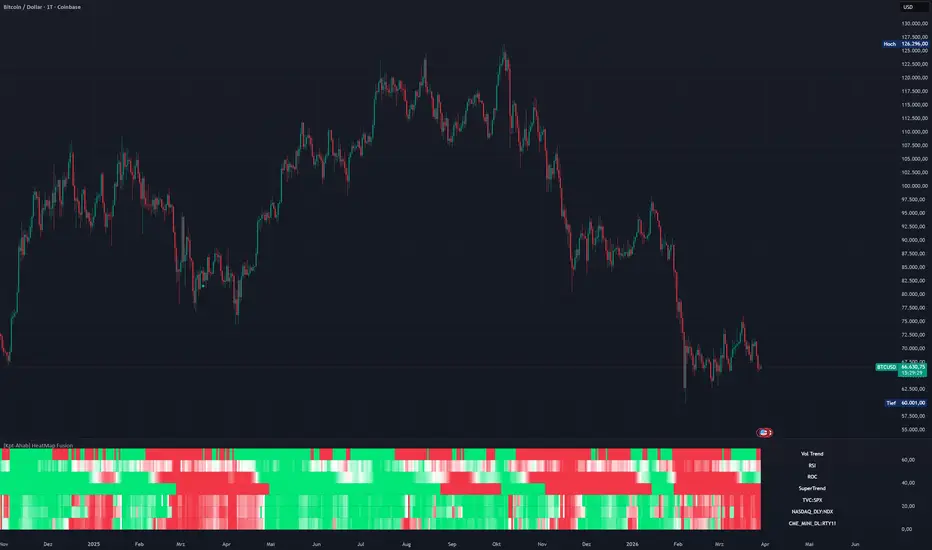
What is “HeatMap Fusion”?
HeatMap Fusion merges RSI, Volume Trend, ROC and an enhanced SuperTrend into one stacked heat-map. Smooth colour gradients reveal—at a glance—whether each component is bullish, neutral, or bearish, without cluttering the chart with multiple separate panes.
Key Features
Multi-indicator heat-map
Three symbols with volume- or price-based colouring.
RSI, ROC and SuperTrend share the same colour scale → instant market-breadth read-out.
View switcher – choose RSI, ROC, SuperTrend, Volume SMA, Up/Down Volume or ALL from a single dropdown.
Six colour schemes (red⇅green, purple⇅blue, etc.) for both light and dark layouts.
Optional RSI divergence detection.
Heikin-Ashi–driven SuperTrend plus Rapid Volatility Trend lines.
Performance-optimised – only three request.security() calls for the selected symbols.
Inputs
Group Core settings
Indicator Layer to display
Color Scheme (Heatmap) 6 presets
Symbol 3 tickers, volume/price mode, look-back length
RSI Period, MA type, BB width, divergence flag
Volume Trend SMA length, up/down columns
ROC Period & intensity threshold
SuperTrend Two ATR sets, Heikin-Ashi on/off
(Every parameter is commented inside the script.)
How to Use
Add the script to any chart.
Set SymCal to on when your symbol has real volume data (futures, ETFs, equities).
Replace the three default tickers with your own—e.g. ES1!, ZB1!, CL1! for a macro setup.
Pick a colour scheme; Purple ⇅ Blue looks great on dark backgrounds.
Choose ALL for the full heat-map with labels, or isolate any single layer via the dropdown.
Notes
The heat-map lives in the main pane on fixed Y-bands (0 – 70). Do not enable Auto-Fit scaling.
If a symbol has no volume, SymCal = on yields no colouring—switch it off to fall back to price-based gradients.
HeatMap Fusion merges RSI, Volume Trend, ROC and an enhanced SuperTrend into one stacked heat-map. Smooth colour gradients reveal—at a glance—whether each component is bullish, neutral, or bearish, without cluttering the chart with multiple separate panes.
Key Features
Multi-indicator heat-map
Three symbols with volume- or price-based colouring.
RSI, ROC and SuperTrend share the same colour scale → instant market-breadth read-out.
View switcher – choose RSI, ROC, SuperTrend, Volume SMA, Up/Down Volume or ALL from a single dropdown.
Six colour schemes (red⇅green, purple⇅blue, etc.) for both light and dark layouts.
Optional RSI divergence detection.
Heikin-Ashi–driven SuperTrend plus Rapid Volatility Trend lines.
Performance-optimised – only three request.security() calls for the selected symbols.
Inputs
Group Core settings
Indicator Layer to display
Color Scheme (Heatmap) 6 presets
Symbol 3 tickers, volume/price mode, look-back length
RSI Period, MA type, BB width, divergence flag
Volume Trend SMA length, up/down columns
ROC Period & intensity threshold
SuperTrend Two ATR sets, Heikin-Ashi on/off
(Every parameter is commented inside the script.)
How to Use
Add the script to any chart.
Set SymCal to on when your symbol has real volume data (futures, ETFs, equities).
Replace the three default tickers with your own—e.g. ES1!, ZB1!, CL1! for a macro setup.
Pick a colour scheme; Purple ⇅ Blue looks great on dark backgrounds.
Choose ALL for the full heat-map with labels, or isolate any single layer via the dropdown.
Notes
The heat-map lives in the main pane on fixed Y-bands (0 – 70). Do not enable Auto-Fit scaling.
If a symbol has no volume, SymCal = on yields no colouring—switch it off to fall back to price-based gradients.
Skrip open-source
Dengan semangat TradingView yang sesungguhnya, pembuat skrip ini telah menjadikannya sebagai sumber terbuka, sehingga para trader dapat meninjau dan memverifikasi fungsinya. Salut untuk penulisnya! Meskipun Anda dapat menggunakannya secara gratis, perlu diingat bahwa penerbitan ulang kode ini tunduk pada Tata Tertib kami.

Pernyataan Penyangkalan
Informasi dan publikasi ini tidak dimaksudkan, dan bukan merupakan, saran atau rekomendasi keuangan, investasi, trading, atau jenis lainnya yang diberikan atau didukung oleh TradingView. Baca selengkapnya di Ketentuan Penggunaan.
Skrip open-source
Dengan semangat TradingView yang sesungguhnya, pembuat skrip ini telah menjadikannya sebagai sumber terbuka, sehingga para trader dapat meninjau dan memverifikasi fungsinya. Salut untuk penulisnya! Meskipun Anda dapat menggunakannya secara gratis, perlu diingat bahwa penerbitan ulang kode ini tunduk pada Tata Tertib kami.
Pernyataan Penyangkalan
Informasi dan publikasi ini tidak dimaksudkan, dan bukan merupakan, saran atau rekomendasi keuangan, investasi, trading, atau jenis lainnya yang diberikan atau didukung oleh TradingView. Baca selengkapnya di Ketentuan Penggunaan.