Diupdate
HTF Bias Ribbon [FCD]
What it shows
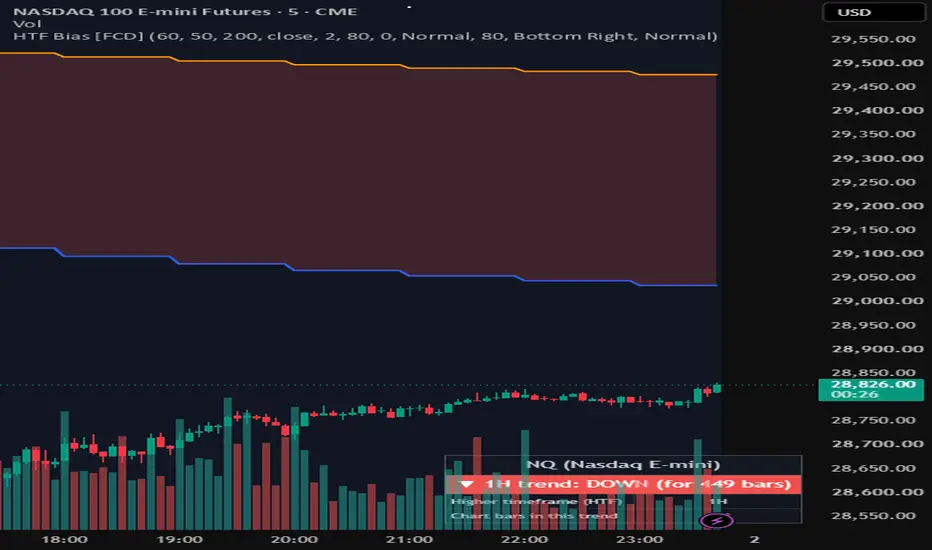
HTF Bias Ribbon draws two exponential moving averages (EMA) calculated on a higher timeframe (HTF = higher timeframe, default 60 minutes = 1H) directly on your lower-timeframe chart, fills the space between them with a color that reflects a simple trend state (UP / DOWN / NEUTRAL), and shows a status box with one plain line such as "▲ 1H trend: UP (for 14 bars)".
How to read it
- Look at the colored top line of the status box: green = 1H trend UP, red = 1H trend DOWN, gray = NEUTRAL. "(for N bars)" is how many chart bars the trend has lasted.
- UP means the fast 1H average is above the slow one AND price is above the fast one. DOWN is the mirror image. Anything else is NEUTRAL (price and the 1H structure disagree).
- The colored band between the two lines shows the same state on every bar, so you can see past changes at a glance.
- A small note ("▲ 1H trend now UP", "▼ 1H trend now DOWN", "● 1H trend now NEUTRAL") marks the bar where the trend changed. Notes appear only after that bar closes, and only the current and previous session are kept.
- A "⚠" note on the last bar means the chart timeframe is not lower than the HTF; pick a lower chart timeframe.
How to set the alert
1. Open the Alerts panel and click Create (the alarm-clock "+" button).
2. Condition: choose "HTF Bias Ribbon [FCD]", then "Any alert() function call".
3. Click Create. You will get one plain message per change, for example "MNQ1!: 1H trend now UP (was NEUTRAL) at price 28770.25". Turn individual types on or off in the indicator's "Alerts" settings.
What makes it different from a plain HTF EMA overlay
Many scripts plot higher-timeframe EMAs. This one adds:
- A documented confirmed-bar (non-repainting) HTF request, so history and realtime behave the same.
- A three-state classification that requires both the HTF EMA order and the chart close's position relative to the HTF fast EMA. A plain overlay only shows where the two lines are.
- A ribbon fill colored by that state, so places where price disagrees with the HTF structure (Neutral) are easy to see.
- A plain-English status box with a "bars in this trend" counter.
- Small change notes on the chart, limited to the current and previous session.
- One-click alerts ("Any alert() function call") with the symbol, the new and old trend and the price in the message, plus separate alert conditions for each change. Alerts are suppressed at the warm-up boundary when the EMAs first appear.
- A timeframe guard that warns you when the chart timeframe is not lower than the selected HTF.
How it is calculated
- A fast EMA (default 50) and a slow EMA (default 200) of the selected source (default close) are calculated on the chosen higher timeframe.
- Both values are requested in a single request.security() call in the non-repainting form described in the Pine Script User Manual: the expression is offset by one bar ([1]) and lookahead = barmerge.lookahead_on is used. As a result, the script only uses the last fully closed higher-timeframe bar. Historical and realtime values behave the same way, and no future data is used. The cost is that the HTF lines update once per completed HTF bar, one HTF bar behind an unconfirmed reading.
- State on each chart bar:
- Up: HTF fast EMA > HTF slow EMA and chart close > HTF fast EMA.
- Down: HTF fast EMA < HTF slow EMA and chart close < HTF fast EMA.
- Neutral: any other case (including when the EMAs are not available yet).
- "Bars in state" counts chart bars since the last state change.
How to use it
Use the ribbon as context: it shows whether price on your chart timeframe agrees with the higher-timeframe EMA structure. NEUTRAL zones mark places where price and the HTF structure disagree. The script only describes the trend state; it is meant to be combined with your own analysis and risk management.
Settings
- Trend Settings: higher timeframe, fast and slow average lengths, price used.
- Display Options: band fill on/off, average lines on/off, bar coloring by trend (off by default), timeframe warning on/off, line width, fill and bar transparency.
- Chart Markers: change notes on/off, include changes to NEUTRAL on/off.
- Alerts: separate on/off for "trend turns UP", "trend turns DOWN", "trend turns NEUTRAL". These alert() messages are confirmed on bar close (they fire once, when the chart bar closes with the new trend).
- Colors: UP, DOWN, NEUTRAL, fast line, slow line, warning note colors.
- Status Box: show/hide, position, text size, background and text colors.
- Individual alert conditions are also available: "Trend changed (any)", "Trend now UP", "Trend now DOWN", "Trend now NEUTRAL". For confirmed readings, set them to "Once Per Bar Close".
Limitations
- The HTF must be higher than the chart timeframe. If it is not, a warning label is shown on the last bar.
- Because the chart close is used in the state test, the state of the current (unclosed) chart bar can change until that bar closes. Closed bars do not change.
- The HTF EMAs need enough history (about 200 HTF bars by default) before they appear.
- The source is recalculated on the HTF. If you choose another indicator's output as the source, its HTF value may differ from what that indicator shows on your chart timeframe.
- Works on any symbol. It was designed with CME index and metal futures (NQ/MNQ, ES/MES, GC/MGC) in mind.
For information and education only. Not financial advice.
HTF Bias Ribbon draws two exponential moving averages (EMA) calculated on a higher timeframe (HTF = higher timeframe, default 60 minutes = 1H) directly on your lower-timeframe chart, fills the space between them with a color that reflects a simple trend state (UP / DOWN / NEUTRAL), and shows a status box with one plain line such as "▲ 1H trend: UP (for 14 bars)".
How to read it
- Look at the colored top line of the status box: green = 1H trend UP, red = 1H trend DOWN, gray = NEUTRAL. "(for N bars)" is how many chart bars the trend has lasted.
- UP means the fast 1H average is above the slow one AND price is above the fast one. DOWN is the mirror image. Anything else is NEUTRAL (price and the 1H structure disagree).
- The colored band between the two lines shows the same state on every bar, so you can see past changes at a glance.
- A small note ("▲ 1H trend now UP", "▼ 1H trend now DOWN", "● 1H trend now NEUTRAL") marks the bar where the trend changed. Notes appear only after that bar closes, and only the current and previous session are kept.
- A "⚠" note on the last bar means the chart timeframe is not lower than the HTF; pick a lower chart timeframe.
How to set the alert
1. Open the Alerts panel and click Create (the alarm-clock "+" button).
2. Condition: choose "HTF Bias Ribbon [FCD]", then "Any alert() function call".
3. Click Create. You will get one plain message per change, for example "MNQ1!: 1H trend now UP (was NEUTRAL) at price 28770.25". Turn individual types on or off in the indicator's "Alerts" settings.
What makes it different from a plain HTF EMA overlay
Many scripts plot higher-timeframe EMAs. This one adds:
- A documented confirmed-bar (non-repainting) HTF request, so history and realtime behave the same.
- A three-state classification that requires both the HTF EMA order and the chart close's position relative to the HTF fast EMA. A plain overlay only shows where the two lines are.
- A ribbon fill colored by that state, so places where price disagrees with the HTF structure (Neutral) are easy to see.
- A plain-English status box with a "bars in this trend" counter.
- Small change notes on the chart, limited to the current and previous session.
- One-click alerts ("Any alert() function call") with the symbol, the new and old trend and the price in the message, plus separate alert conditions for each change. Alerts are suppressed at the warm-up boundary when the EMAs first appear.
- A timeframe guard that warns you when the chart timeframe is not lower than the selected HTF.
How it is calculated
- A fast EMA (default 50) and a slow EMA (default 200) of the selected source (default close) are calculated on the chosen higher timeframe.
- Both values are requested in a single request.security() call in the non-repainting form described in the Pine Script User Manual: the expression is offset by one bar ([1]) and lookahead = barmerge.lookahead_on is used. As a result, the script only uses the last fully closed higher-timeframe bar. Historical and realtime values behave the same way, and no future data is used. The cost is that the HTF lines update once per completed HTF bar, one HTF bar behind an unconfirmed reading.
- State on each chart bar:
- Up: HTF fast EMA > HTF slow EMA and chart close > HTF fast EMA.
- Down: HTF fast EMA < HTF slow EMA and chart close < HTF fast EMA.
- Neutral: any other case (including when the EMAs are not available yet).
- "Bars in state" counts chart bars since the last state change.
How to use it
Use the ribbon as context: it shows whether price on your chart timeframe agrees with the higher-timeframe EMA structure. NEUTRAL zones mark places where price and the HTF structure disagree. The script only describes the trend state; it is meant to be combined with your own analysis and risk management.
Settings
- Trend Settings: higher timeframe, fast and slow average lengths, price used.
- Display Options: band fill on/off, average lines on/off, bar coloring by trend (off by default), timeframe warning on/off, line width, fill and bar transparency.
- Chart Markers: change notes on/off, include changes to NEUTRAL on/off.
- Alerts: separate on/off for "trend turns UP", "trend turns DOWN", "trend turns NEUTRAL". These alert() messages are confirmed on bar close (they fire once, when the chart bar closes with the new trend).
- Colors: UP, DOWN, NEUTRAL, fast line, slow line, warning note colors.
- Status Box: show/hide, position, text size, background and text colors.
- Individual alert conditions are also available: "Trend changed (any)", "Trend now UP", "Trend now DOWN", "Trend now NEUTRAL". For confirmed readings, set them to "Once Per Bar Close".
Limitations
- The HTF must be higher than the chart timeframe. If it is not, a warning label is shown on the last bar.
- Because the chart close is used in the state test, the state of the current (unclosed) chart bar can change until that bar closes. Closed bars do not change.
- The HTF EMAs need enough history (about 200 HTF bars by default) before they appear.
- The source is recalculated on the HTF. If you choose another indicator's output as the source, its HTF value may differ from what that indicator shows on your chart timeframe.
- Works on any symbol. It was designed with CME index and metal futures (NQ/MNQ, ES/MES, GC/MGC) in mind.
For information and education only. Not financial advice.
Catatan Rilis
Markets: CME NQ/MNQ (Nasdaq), ES/MES (S&P 500), GC/MGC (Gold) - intraday.Use on: NQ/MNQ, ES/MES or GC/MGC on a 1 to 15 minute chart (trend read from the 1-hour chart by default).
What's new
- The status box now shows the market you are on, e.g. "MNQ (Nasdaq micro)". A red banner appears if the symbol is not one of the supported CME markets.
- Trend-change notes are larger and solid-colored, with a size setting.
- New "Highlight event bars" option shades the bar where the trend changed (on by default).
- Every note type has its own alert toggle; one "Any alert() function call" alert covers all of them.

Pernyataan Penyangkalan
Informasi dan publikasi ini tidak dimaksudkan, dan bukan merupakan, saran atau rekomendasi keuangan, investasi, trading, atau jenis lainnya yang diberikan atau didukung oleh TradingView. Baca selengkapnya di Ketentuan Penggunaan.
Pernyataan Penyangkalan
Informasi dan publikasi ini tidak dimaksudkan, dan bukan merupakan, saran atau rekomendasi keuangan, investasi, trading, atau jenis lainnya yang diberikan atau didukung oleh TradingView. Baca selengkapnya di Ketentuan Penggunaan.