Planting & Harvesting Seasons V1.1
Overview
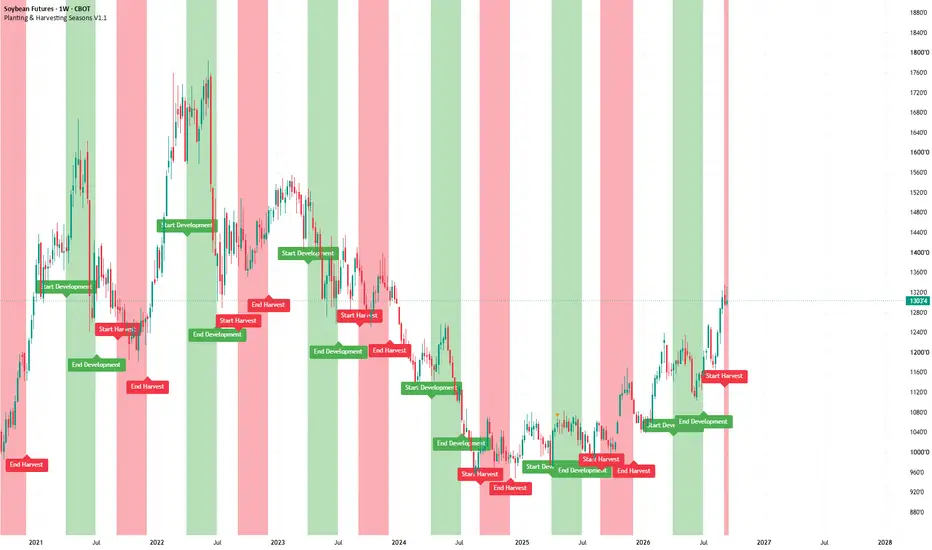
As a commodity trader, seasonal patterns play a big role in my analysis. This script visually overlays the typical planting and harvesting periods for key agricultural futures directly on the chart. It automatically detects the underlying commodity based on the symbol (e.g. ZC, ZW, ZS, CT) and displays color-coded zones for each seasonal window.
These zones are based on historical crop calendars and help identify when planting or harvesting typically takes place, so technical setups can be better aligned with fundamental seasonal factors.
How It Works
The script reads the chart's symbol root and matches it against a built-in table of crop development and harvest windows (month ranges) for supported futures. Two background zones are drawn:
Development (green) — the typical crop development/growing period
Harvest (red) — the typical harvest period
Labels mark the start and end of each zone as the chart crosses into or out of it. Month ranges that cross the calendar year boundary (e.g. harvest starting in one year and ending in the next) are handled correctly.
Supported Markets
Chicago Wheat (ZW), Corn (ZC), Soybeans (ZS), Rough Rice (ZR), Cotton (CT), Oats (ZO), Cocoa (CC), Coffee (KC), Sugar (SB), Orange Juice (OJ).
What This Script Does Not Do
This is a visual aid only — it does not generate buy or sell signals, does not predict price direction, and is not a standalone trading system. Crop calendars are based on typical/historical timing and can vary by growing region and year.
Limitations
Actual planting and harvest timing can shift from year to year due to weather, regional differences, and other agronomic factors. The zones shown are typical historical windows, not a forecast for the current season.
Changelog (V1.1)
Improved terminology inside the script (crop development and harvest phases)
Improved month-range handling for seasons that cross the calendar year boundary
Updated futures-relevant windows for ZC, CC, KC, SB and OJ
Feedback is always appreciated!
As a commodity trader, seasonal patterns play a big role in my analysis. This script visually overlays the typical planting and harvesting periods for key agricultural futures directly on the chart. It automatically detects the underlying commodity based on the symbol (e.g. ZC, ZW, ZS, CT) and displays color-coded zones for each seasonal window.
These zones are based on historical crop calendars and help identify when planting or harvesting typically takes place, so technical setups can be better aligned with fundamental seasonal factors.
How It Works
The script reads the chart's symbol root and matches it against a built-in table of crop development and harvest windows (month ranges) for supported futures. Two background zones are drawn:
Development (green) — the typical crop development/growing period
Harvest (red) — the typical harvest period
Labels mark the start and end of each zone as the chart crosses into or out of it. Month ranges that cross the calendar year boundary (e.g. harvest starting in one year and ending in the next) are handled correctly.
Supported Markets
Chicago Wheat (ZW), Corn (ZC), Soybeans (ZS), Rough Rice (ZR), Cotton (CT), Oats (ZO), Cocoa (CC), Coffee (KC), Sugar (SB), Orange Juice (OJ).
What This Script Does Not Do
This is a visual aid only — it does not generate buy or sell signals, does not predict price direction, and is not a standalone trading system. Crop calendars are based on typical/historical timing and can vary by growing region and year.
Limitations
Actual planting and harvest timing can shift from year to year due to weather, regional differences, and other agronomic factors. The zones shown are typical historical windows, not a forecast for the current season.
Changelog (V1.1)
Improved terminology inside the script (crop development and harvest phases)
Improved month-range handling for seasons that cross the calendar year boundary
Updated futures-relevant windows for ZC, CC, KC, SB and OJ
Feedback is always appreciated!

Pernyataan Penyangkalan
Informasi dan publikasi ini tidak dimaksudkan, dan bukan merupakan, saran atau rekomendasi keuangan, investasi, trading, atau jenis lainnya yang diberikan atau didukung oleh TradingView. Baca selengkapnya di Ketentuan Penggunaan.
Pernyataan Penyangkalan
Informasi dan publikasi ini tidak dimaksudkan, dan bukan merupakan, saran atau rekomendasi keuangan, investasi, trading, atau jenis lainnya yang diberikan atau didukung oleh TradingView. Baca selengkapnya di Ketentuan Penggunaan.