Regime - Adaptive Market Intelligence
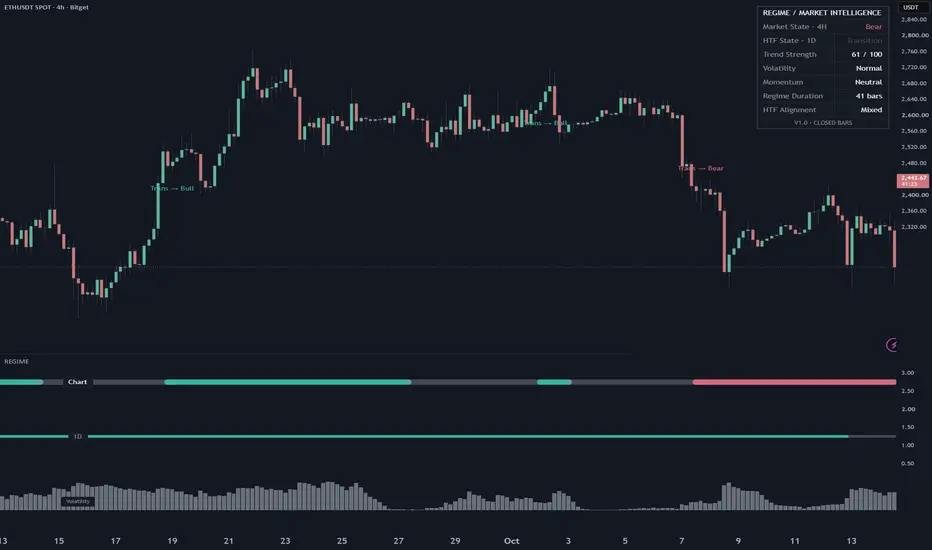
I built Regime to make market context easier to read without covering the chart in signals. It describes the current market regime, shows the last confirmed higher timeframe regime, and keeps trend strength, momentum and relative volatility together in a compact dashboard.
This is a market analysis indicator, not a trading strategy. It does not generate buy/sell signals, entries, stop losses, take-profit targets or performance scores. The initial defaults were designed around BTC and ETH spot charts on 1H and 4H.
What you see
The upper strip in the indicator pane shows the chart timeframe regime:
- Bull, in teal: confirmed upward trend conditions.
- Bear, in muted red: confirmed downward trend conditions.
- Range, in gold: confirmed low-direction consolidation conditions.
- Transition, in gray: no confirmed trend or range, or the previous state's holding conditions no longer apply.
The thinner strip shows confirmed higher timeframe history. Automatic selection uses 4H on a 1H chart and 1D on a 4H chart. Manual choices are 4H, 1D and 1W; the selected higher timeframe must be greater than the chart timeframe. The two strips are independent: higher timeframe context does not block a local regime change.
The lower columns show relative ATR% intensity. Violet marks the confirmed High volatility state; gray is used for Normal and Low. Column height is the percentile rank of ATR%, not a price forecast. High volatility is separate from the four directional regimes.
Small labels mark confirmed changes into Bull, Bear or Range at the actual confirmation candle. Only the latest three labels are retained by default; the count is configurable from 1 to 20. Changes into Transition remain visible in the timeline without another candle label.
How the regime is calculated
The classifier combines EMA 20, EMA 50, ATR 14 and ADX from DMI 14/14. EMA separation is divided by ATR, and the five-bar change in EMA 50 is also divided by ATR. This expresses direction and slope relative to recent price movement instead of fixed price distances.
With the default settings, a Bull candidate requires ADX of at least 22, normalized EMA separation of at least 0.25, and normalized EMA 50 slope of at least 0.10. A Bear candidate uses the same ADX requirement with separation at or below -0.25 and slope at or below -0.10. A Range candidate requires ADX at or below 18, absolute separation at or below 0.20, and absolute slope at or below 0.10.
Trend candidates require two consecutive qualifying candles, and Range requires three by default. These confirmation counts are configurable. Until a new state confirms, an existing Bull state may persist with ADX of at least 18 and positive separation and slope; Bear uses negative separation and slope. Range may persist while ADX is below 22, absolute separation is below 0.35, and absolute slope is below 0.20. If no state can be confirmed or retained, the result is Transition.
The separate entry, holding and exit conditions are intended to reduce rapid switching. They also introduce delay: the script is describing a confirmed condition, not identifying an exact turning point. The thresholds are design defaults, not statistically proven optimal parameters.
Volatility and momentum
ATR% is ATR 14 divided by closing price and multiplied by 100. The default volatility reference is 30 calendar days converted to chart bars, with a minimum of 20 and a maximum of 1,200 bars. Thresholds use prior-bar ATR% history. High uses the 85th percentile for entry and the 70th percentile for retention. Low uses the 20th percentile for entry and the 30th percentile for retention. Normal applies between those conditions. A new volatility state requires two consecutive candidates. Column intensity uses the current confirmed ATR% percentile rank.
Momentum is a dashboard description from RSI 14: Positive at 55 or above, Negative at 45 or below, and Neutral between. RSI does not determine the directional regime.
Reading the dashboard
- Market State: latest confirmed regime on the chart timeframe.
- HTF State: regime from the previous completed higher timeframe candle.
- Trend Strength: ADX mapped to a 0-100 scale using (ADX - 10) / 30, then clamped. ADX of 10 or less displays 0; ADX of 40 or more displays 100. This is not a probability, accuracy score or confidence percentage.
- Volatility: Low, Normal or High relative to recent ATR% history.
- Momentum: Positive, Negative or Neutral from RSI.
- Regime Duration: consecutive chart bars in the current confirmed state, including Transition.
- HTF Alignment: Aligned when both timeframes are Bull or both are Bear; Not aligned when their trend directions oppose; Mixed when either is Range or Transition; N/A when data is insufficient.
For example, Chart Bear with HTF Bull means bearish conditions have confirmed locally while the higher timeframe still carries bullish context. It is a description of different horizons, not an instruction to trade. The dashboard always describes the latest confirmed data; it does not follow the historical candle under the cursor.
Confirmation and repainting behavior
Local displayed values and transition labels update on confirmed chart candles. While a candle is open, the local display carries the preceding confirmed result. Higher timeframe data comes from the previous completed higher timeframe candle, using an expression offset of one HTF bar together with lookahead_on. It becomes available at the start of the next HTF period, without using an unfinished HTF candle or future information. Labels are not backdated to earlier turning points.
Source review and five matched-bar reload checks found no regime-state discrepancy: BTC/ETH 1H and 4H historical samples, plus one ETH one-minute candle observed through close and reload. This is sample-based verification, not an exhaustive guarantee. That live minute check did not include a new regime transition or a higher timeframe boundary. Exchange data corrections, different settings, or a different history starting point can change recalculated results.
How to use it
Add the indicator to a standard time-based candlestick chart. Start with BTCUSDT or ETHUSDT on 1H or 4H and leave Higher timeframe on Automatic. Read the chart regime first, compare it with the HTF strip, then use the dashboard and volatility columns to understand the context. Choose Dark or Light in Appearance to match your chart. The dashboard, HTF history, volatility columns and transition markers can each be hidden independently.
The code accepts intraday and daily time-based charts. On a daily chart, choose a greater manual HTF such as 1W. Allow sufficient history for the classifier and rolling volatility reference. N/A or missing early plots indicate insufficient data. Other symbols and intervals are not validated target markets for these defaults. The script does not create alert conditions.
Why i combined these components
The individual indicators are standard. The contribution here is the explicit four-state classifier with ATR-normalized direction and slope, separate entry/holding rules, consecutive-bar confirmation, and an independent confirmed HTF history. RSI momentum and relative volatility remain context rather than extra directional votes. The display makes agreement and disagreement between horizons visible without adding trade instructions.
License
Copyright 2026 builtbyuba / domuba. Released under Creative Commons Attribution-NonCommercial-ShareAlike 4.0 International. Noncommercial use, modification and sharing are permitted with attribution, a license reference and a notice of changes. Shared adaptations must use the same license. Resale, paid access and other commercial exploitation require separate permission. Reuse in TradingView publications must also follow TradingView's script publishing rules.
Provided as-is for market analysis. No profitability claims or trading recommendations.
Chart examples
ETHUSDT spot, 4H with confirmed daily context. These historical examples illustrate the interface and different market regimes, not trading performance.

ETHUSDT spot, 1H with confirmed 4H context. A local regime may change while the last confirmed higher timeframe state remains different. The dashboard describes the latest confirmed data at the time of capture.

This is a market analysis indicator, not a trading strategy. It does not generate buy/sell signals, entries, stop losses, take-profit targets or performance scores. The initial defaults were designed around BTC and ETH spot charts on 1H and 4H.
What you see
The upper strip in the indicator pane shows the chart timeframe regime:
- Bull, in teal: confirmed upward trend conditions.
- Bear, in muted red: confirmed downward trend conditions.
- Range, in gold: confirmed low-direction consolidation conditions.
- Transition, in gray: no confirmed trend or range, or the previous state's holding conditions no longer apply.
The thinner strip shows confirmed higher timeframe history. Automatic selection uses 4H on a 1H chart and 1D on a 4H chart. Manual choices are 4H, 1D and 1W; the selected higher timeframe must be greater than the chart timeframe. The two strips are independent: higher timeframe context does not block a local regime change.
The lower columns show relative ATR% intensity. Violet marks the confirmed High volatility state; gray is used for Normal and Low. Column height is the percentile rank of ATR%, not a price forecast. High volatility is separate from the four directional regimes.
Small labels mark confirmed changes into Bull, Bear or Range at the actual confirmation candle. Only the latest three labels are retained by default; the count is configurable from 1 to 20. Changes into Transition remain visible in the timeline without another candle label.
How the regime is calculated
The classifier combines EMA 20, EMA 50, ATR 14 and ADX from DMI 14/14. EMA separation is divided by ATR, and the five-bar change in EMA 50 is also divided by ATR. This expresses direction and slope relative to recent price movement instead of fixed price distances.
With the default settings, a Bull candidate requires ADX of at least 22, normalized EMA separation of at least 0.25, and normalized EMA 50 slope of at least 0.10. A Bear candidate uses the same ADX requirement with separation at or below -0.25 and slope at or below -0.10. A Range candidate requires ADX at or below 18, absolute separation at or below 0.20, and absolute slope at or below 0.10.
Trend candidates require two consecutive qualifying candles, and Range requires three by default. These confirmation counts are configurable. Until a new state confirms, an existing Bull state may persist with ADX of at least 18 and positive separation and slope; Bear uses negative separation and slope. Range may persist while ADX is below 22, absolute separation is below 0.35, and absolute slope is below 0.20. If no state can be confirmed or retained, the result is Transition.
The separate entry, holding and exit conditions are intended to reduce rapid switching. They also introduce delay: the script is describing a confirmed condition, not identifying an exact turning point. The thresholds are design defaults, not statistically proven optimal parameters.
Volatility and momentum
ATR% is ATR 14 divided by closing price and multiplied by 100. The default volatility reference is 30 calendar days converted to chart bars, with a minimum of 20 and a maximum of 1,200 bars. Thresholds use prior-bar ATR% history. High uses the 85th percentile for entry and the 70th percentile for retention. Low uses the 20th percentile for entry and the 30th percentile for retention. Normal applies between those conditions. A new volatility state requires two consecutive candidates. Column intensity uses the current confirmed ATR% percentile rank.
Momentum is a dashboard description from RSI 14: Positive at 55 or above, Negative at 45 or below, and Neutral between. RSI does not determine the directional regime.
Reading the dashboard
- Market State: latest confirmed regime on the chart timeframe.
- HTF State: regime from the previous completed higher timeframe candle.
- Trend Strength: ADX mapped to a 0-100 scale using (ADX - 10) / 30, then clamped. ADX of 10 or less displays 0; ADX of 40 or more displays 100. This is not a probability, accuracy score or confidence percentage.
- Volatility: Low, Normal or High relative to recent ATR% history.
- Momentum: Positive, Negative or Neutral from RSI.
- Regime Duration: consecutive chart bars in the current confirmed state, including Transition.
- HTF Alignment: Aligned when both timeframes are Bull or both are Bear; Not aligned when their trend directions oppose; Mixed when either is Range or Transition; N/A when data is insufficient.
For example, Chart Bear with HTF Bull means bearish conditions have confirmed locally while the higher timeframe still carries bullish context. It is a description of different horizons, not an instruction to trade. The dashboard always describes the latest confirmed data; it does not follow the historical candle under the cursor.
Confirmation and repainting behavior
Local displayed values and transition labels update on confirmed chart candles. While a candle is open, the local display carries the preceding confirmed result. Higher timeframe data comes from the previous completed higher timeframe candle, using an expression offset of one HTF bar together with lookahead_on. It becomes available at the start of the next HTF period, without using an unfinished HTF candle or future information. Labels are not backdated to earlier turning points.
Source review and five matched-bar reload checks found no regime-state discrepancy: BTC/ETH 1H and 4H historical samples, plus one ETH one-minute candle observed through close and reload. This is sample-based verification, not an exhaustive guarantee. That live minute check did not include a new regime transition or a higher timeframe boundary. Exchange data corrections, different settings, or a different history starting point can change recalculated results.
How to use it
Add the indicator to a standard time-based candlestick chart. Start with BTCUSDT or ETHUSDT on 1H or 4H and leave Higher timeframe on Automatic. Read the chart regime first, compare it with the HTF strip, then use the dashboard and volatility columns to understand the context. Choose Dark or Light in Appearance to match your chart. The dashboard, HTF history, volatility columns and transition markers can each be hidden independently.
The code accepts intraday and daily time-based charts. On a daily chart, choose a greater manual HTF such as 1W. Allow sufficient history for the classifier and rolling volatility reference. N/A or missing early plots indicate insufficient data. Other symbols and intervals are not validated target markets for these defaults. The script does not create alert conditions.
Why i combined these components
The individual indicators are standard. The contribution here is the explicit four-state classifier with ATR-normalized direction and slope, separate entry/holding rules, consecutive-bar confirmation, and an independent confirmed HTF history. RSI momentum and relative volatility remain context rather than extra directional votes. The display makes agreement and disagreement between horizons visible without adding trade instructions.
License
Copyright 2026 builtbyuba / domuba. Released under Creative Commons Attribution-NonCommercial-ShareAlike 4.0 International. Noncommercial use, modification and sharing are permitted with attribution, a license reference and a notice of changes. Shared adaptations must use the same license. Resale, paid access and other commercial exploitation require separate permission. Reuse in TradingView publications must also follow TradingView's script publishing rules.
Provided as-is for market analysis. No profitability claims or trading recommendations.
Chart examples
ETHUSDT spot, 4H with confirmed daily context. These historical examples illustrate the interface and different market regimes, not trading performance.
ETHUSDT spot, 1H with confirmed 4H context. A local regime may change while the last confirmed higher timeframe state remains different. The dashboard describes the latest confirmed data at the time of capture.

Pernyataan Penyangkalan
Informasi dan publikasi ini tidak dimaksudkan, dan bukan merupakan, saran atau rekomendasi keuangan, investasi, trading, atau jenis lainnya yang diberikan atau didukung oleh TradingView. Baca selengkapnya di Ketentuan Penggunaan.
Pernyataan Penyangkalan
Informasi dan publikasi ini tidak dimaksudkan, dan bukan merupakan, saran atau rekomendasi keuangan, investasi, trading, atau jenis lainnya yang diberikan atau didukung oleh TradingView. Baca selengkapnya di Ketentuan Penggunaan.