Psychology Meter
Psychology Meter
WHAT IT DOES
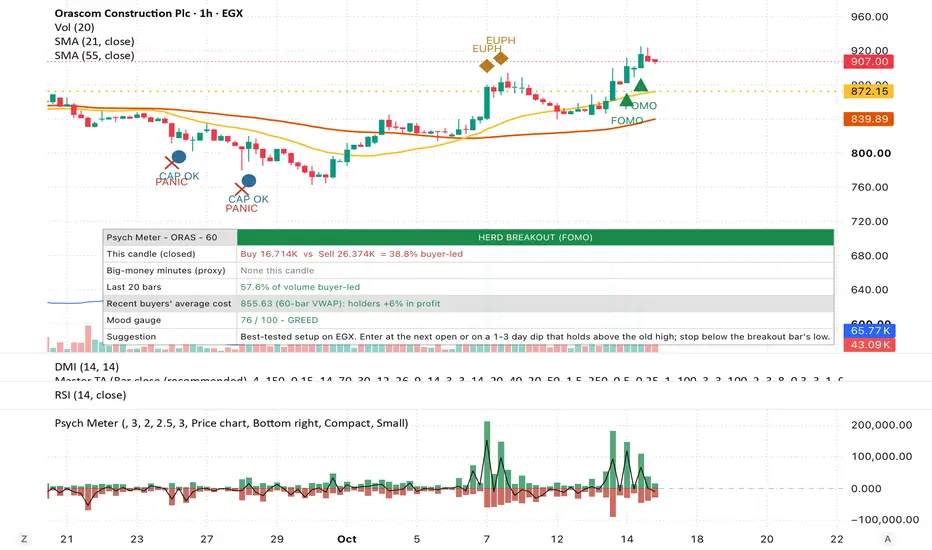
This indicator reads crowd behaviour from data the chart can actually measure. For every candle it shows how much volume was bought versus sold, how many of the bars inside the candle were buyer-led or seller-led, and what the largest-volume bars inside the candle did. It then classifies the crowd into a psychological phase (panic, fear, hope, optimism, FOMO breakout, euphoria and others) and explains in plain words what that phase means and how traders usually handle it.
HOW IT WORKS
1. Buy vs sell volume inside each candle
The script loads the lower-timeframe bars that make up each candle with request.security_lower_tf(). Each intrabar is classified with the tick rule: a bar that closes above its open is buyer-led, below its open is seller-led, and an unchanged bar keeps the direction of the previous bar. The volume of buyer-led bars is summed as buy volume, seller-led bars as sell volume.
- Auto intrabar timeframe: 5 minutes on a daily chart, 60 minutes on a weekly chart, 240 minutes on a monthly chart, 1 minute on intraday charts. You can override it.
- The dashboard shows how many intrabars were used and what share of the candle's volume they cover.
- If no intrabar data exists (old history, illiquid symbols), the meter falls back to an estimate based on where the candle closed in its range and labels it ESTIMATE.
This is a classification of price direction, not exchange trade-by-trade aggressor data.
2. Big-money bars (proxy)
Intrabars whose volume is at least 3x the candle's average intrabar volume are flagged as big-money bars. The dashboard shows what share of that large volume was buying. Large orders tend to come from institutions, so this is a proxy for large players, not proof of who traded.
3. Behaviour signals (closed bars only, no repainting)
- FOMO breakout: up close above the prior 252-bar high on at least 2x the 20-bar average volume.
- Euphoria: up close on at least 2.5x volume with RSI(14) above 75 and price more than 2.5 ATR above the 20-bar average.
- Panic: down close on at least 2.5x volume with RSI(14) below 35.
- Capitulation confirmed: a panic bar that closed in the upper 70% of its range, followed by a higher close on the next bar.
- Sellers in control: less than 35% of the last 20 bars' volume traded on up bars, with price below the 50-bar average.
4. Crowd phase and mood gauge
Phases are assigned in priority order from the signals above and from price relative to the 50- and 200-bar averages and the 52-week high: Euphoria, Herd breakout (FOMO), Capitulation confirmed, Panic, Fear - sellers in control, Optimism at the high (anchoring), Optimism - uptrend, Anxiety - pullback, Hope - recovery, Depression - downtrend.
The mood gauge (0-100) averages RSI(14), position in the 52-week range, distance from the 20-bar average in ATR, and the 20-bar buyer share. It describes the current mood; it is not a forecast.
The recent buyers' average cost is the 60-bar volume-weighted average price, shown with how far holders are in profit or under water.
5. Dashboard
The dashboard can be shown on the price chart, where it floats over the candles, or in the indicator's own pane. It can be placed in any of 9 positions, in three layouts:
- Compact (default): crowd phase, this candle's buy/sell split, big-money bars, last 20 bars, recent buyers' average cost, mood gauge and suggestion.
- Full: adds the number of buyer-led and seller-led intrabars, data source and coverage, distance from the 52-week high, what the phase means, the tested result for the current signal, bars since each signal, and notes.
- Phase only: a single line with the current crowd phase.
Text size can be set from Tiny to Large. The buy/sell volume columns in the pane can be hidden if you only want the dashboard.
TESTED STATISTICS
The signal statistics shown in the dashboard come from a test on 75 liquid Egyptian Exchange (EGX) stocks, daily bars, June 2015 to September 2026, with entry at the next open and results measured 5 and 20 sessions later. For comparison, a typical day was up after 20 sessions 52% of the time with a median return of +0.5%.
- FOMO breakout: up after 5 sessions 57%, after 20 sessions 56%, median 20-session return +2.5%.
- Euphoria: up after 5 sessions 56%, after 20 sessions 55%, median +2.2%.
- Panic bought on the day: up after 5 sessions 46%, worse than a typical day.
- Capitulation confirmed: up after 20 sessions 57%, median +1.0% (small sample).
- Sellers in control: up after 20 sessions 49%, median 0.0%.
These are past frequencies on one market. They are not predictions and every signal had losing years. On any other market the dashboard states that the statistics were not tested there.
HOW TO USE
- Use the daily chart for the tested signals; use lower timeframes to watch buy/sell volume during the session.
- Open the settings (gear icon) and choose the dashboard place, position and layout under Display. Pick a corner where your chart has empty space so the table does not cover the candles.
- Read the phase first, then check whether the current candle and the last 20 bars are buyer-led (above 55%) or seller-led (below 45%).
- A FOMO breakout with buyer-led volume and big-money bars buying is the strongest combination.
- Do not buy a panic bar on its own; wait for the next bar to close higher.
- Alerts are available for FOMO breakout, euphoria, panic, capitulation confirmed, sellers taking control, and big-money bars buying or selling. All alerts fire on bar close.
OTHER MARKETS
The calculations work on any symbol that has real volume and intraday history: stocks, ETFs, futures and crypto. On forex and CFDs the volume is tick volume (a count of price changes), and the dashboard warns about this. Volume is detected from the data itself, not from the symbol's volume-type label; only symbols that have never had any volume show NO VOLUME DATA.
LIMITATIONS
- Buy/sell volume is classified from intrabar price direction, not from exchange trade records. Data depth for intrabars depends on your TradingView plan and the symbol.
- Investor identity (for example foreign versus local, retail versus institutional) is not available inside TradingView and is not shown.
- The live candle's buy/sell split is labelled DEVELOPING until it closes.
This indicator is for education and analysis. It does not give financial advice.
WHAT IT DOES
This indicator reads crowd behaviour from data the chart can actually measure. For every candle it shows how much volume was bought versus sold, how many of the bars inside the candle were buyer-led or seller-led, and what the largest-volume bars inside the candle did. It then classifies the crowd into a psychological phase (panic, fear, hope, optimism, FOMO breakout, euphoria and others) and explains in plain words what that phase means and how traders usually handle it.
HOW IT WORKS
1. Buy vs sell volume inside each candle
The script loads the lower-timeframe bars that make up each candle with request.security_lower_tf(). Each intrabar is classified with the tick rule: a bar that closes above its open is buyer-led, below its open is seller-led, and an unchanged bar keeps the direction of the previous bar. The volume of buyer-led bars is summed as buy volume, seller-led bars as sell volume.
- Auto intrabar timeframe: 5 minutes on a daily chart, 60 minutes on a weekly chart, 240 minutes on a monthly chart, 1 minute on intraday charts. You can override it.
- The dashboard shows how many intrabars were used and what share of the candle's volume they cover.
- If no intrabar data exists (old history, illiquid symbols), the meter falls back to an estimate based on where the candle closed in its range and labels it ESTIMATE.
This is a classification of price direction, not exchange trade-by-trade aggressor data.
2. Big-money bars (proxy)
Intrabars whose volume is at least 3x the candle's average intrabar volume are flagged as big-money bars. The dashboard shows what share of that large volume was buying. Large orders tend to come from institutions, so this is a proxy for large players, not proof of who traded.
3. Behaviour signals (closed bars only, no repainting)
- FOMO breakout: up close above the prior 252-bar high on at least 2x the 20-bar average volume.
- Euphoria: up close on at least 2.5x volume with RSI(14) above 75 and price more than 2.5 ATR above the 20-bar average.
- Panic: down close on at least 2.5x volume with RSI(14) below 35.
- Capitulation confirmed: a panic bar that closed in the upper 70% of its range, followed by a higher close on the next bar.
- Sellers in control: less than 35% of the last 20 bars' volume traded on up bars, with price below the 50-bar average.
4. Crowd phase and mood gauge
Phases are assigned in priority order from the signals above and from price relative to the 50- and 200-bar averages and the 52-week high: Euphoria, Herd breakout (FOMO), Capitulation confirmed, Panic, Fear - sellers in control, Optimism at the high (anchoring), Optimism - uptrend, Anxiety - pullback, Hope - recovery, Depression - downtrend.
The mood gauge (0-100) averages RSI(14), position in the 52-week range, distance from the 20-bar average in ATR, and the 20-bar buyer share. It describes the current mood; it is not a forecast.
The recent buyers' average cost is the 60-bar volume-weighted average price, shown with how far holders are in profit or under water.
5. Dashboard
The dashboard can be shown on the price chart, where it floats over the candles, or in the indicator's own pane. It can be placed in any of 9 positions, in three layouts:
- Compact (default): crowd phase, this candle's buy/sell split, big-money bars, last 20 bars, recent buyers' average cost, mood gauge and suggestion.
- Full: adds the number of buyer-led and seller-led intrabars, data source and coverage, distance from the 52-week high, what the phase means, the tested result for the current signal, bars since each signal, and notes.
- Phase only: a single line with the current crowd phase.
Text size can be set from Tiny to Large. The buy/sell volume columns in the pane can be hidden if you only want the dashboard.
TESTED STATISTICS
The signal statistics shown in the dashboard come from a test on 75 liquid Egyptian Exchange (EGX) stocks, daily bars, June 2015 to September 2026, with entry at the next open and results measured 5 and 20 sessions later. For comparison, a typical day was up after 20 sessions 52% of the time with a median return of +0.5%.
- FOMO breakout: up after 5 sessions 57%, after 20 sessions 56%, median 20-session return +2.5%.
- Euphoria: up after 5 sessions 56%, after 20 sessions 55%, median +2.2%.
- Panic bought on the day: up after 5 sessions 46%, worse than a typical day.
- Capitulation confirmed: up after 20 sessions 57%, median +1.0% (small sample).
- Sellers in control: up after 20 sessions 49%, median 0.0%.
These are past frequencies on one market. They are not predictions and every signal had losing years. On any other market the dashboard states that the statistics were not tested there.
HOW TO USE
- Use the daily chart for the tested signals; use lower timeframes to watch buy/sell volume during the session.
- Open the settings (gear icon) and choose the dashboard place, position and layout under Display. Pick a corner where your chart has empty space so the table does not cover the candles.
- Read the phase first, then check whether the current candle and the last 20 bars are buyer-led (above 55%) or seller-led (below 45%).
- A FOMO breakout with buyer-led volume and big-money bars buying is the strongest combination.
- Do not buy a panic bar on its own; wait for the next bar to close higher.
- Alerts are available for FOMO breakout, euphoria, panic, capitulation confirmed, sellers taking control, and big-money bars buying or selling. All alerts fire on bar close.
OTHER MARKETS
The calculations work on any symbol that has real volume and intraday history: stocks, ETFs, futures and crypto. On forex and CFDs the volume is tick volume (a count of price changes), and the dashboard warns about this. Volume is detected from the data itself, not from the symbol's volume-type label; only symbols that have never had any volume show NO VOLUME DATA.
LIMITATIONS
- Buy/sell volume is classified from intrabar price direction, not from exchange trade records. Data depth for intrabars depends on your TradingView plan and the symbol.
- Investor identity (for example foreign versus local, retail versus institutional) is not available inside TradingView and is not shown.
- The live candle's buy/sell split is labelled DEVELOPING until it closes.
This indicator is for education and analysis. It does not give financial advice.

Pernyataan Penyangkalan
Informasi dan publikasi ini tidak dimaksudkan, dan bukan merupakan, saran atau rekomendasi keuangan, investasi, trading, atau jenis lainnya yang diberikan atau didukung oleh TradingView. Baca selengkapnya di Ketentuan Penggunaan.
Pernyataan Penyangkalan
Informasi dan publikasi ini tidak dimaksudkan, dan bukan merupakan, saran atau rekomendasi keuangan, investasi, trading, atau jenis lainnya yang diberikan atau didukung oleh TradingView. Baca selengkapnya di Ketentuan Penggunaan.