OPEN-SOURCE SCRIPT
Adaptive Support & Resistance Pro + Signals
Overview
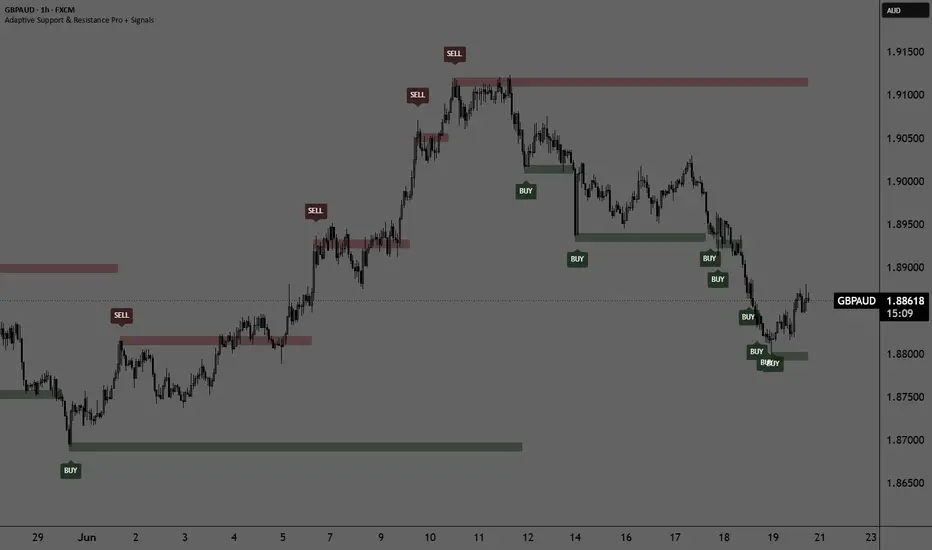
Adaptive Support & Resistance Pro is a dynamic technical analysis tool designed to automatically identify, calculate, and plot key Support and Resistance (S/R) levels on your chart. Unlike traditional pivot-based indicators, this script uses a hybrid approach combining Momentum, Relative Strength, and Volatility filters to pinpoint institutional supply and demand zones.
To ensure professional-grade execution, the script is fully optimized to prevent repainting. It operates strictly in real-time, aligning historical signals with the exact moments these key levels were formed.
How It Works (The Engine)
The indicator calculates its levels based on three core components:
Chande Momentum Oscillator (CMO) via HMA: It analyzes the rate of change between two Hull Moving Averages (HMA) of different periods to detect strong shifts in market momentum.
Relative Strength Index (RSI): A 9-period RSI filters out minor market noise, ensuring that support levels are only tracked in oversold conditions ( RSI < 25$) and resistance levels in overbought conditions (RSI > 75$).
Legacy Close Pivots: The script analyzes extreme high/low deviations over a specific lookback period to establish the structural price floor or ceiling.
When all three conditions align, a new Support or Resistance price level is established.
Key Features & Settings
Multi-Timeframe (S/R Timeframe): You can plot S/R levels from higher timeframes (e.g., Daily or 4-Hour) directly onto your lower timeframe execution chart (e.g., 15-minute) for top-down analysis.
Signal Trigger Modes: Under the settings, you can choose how signals are displayed:
On Candle Close: Displays a BUY or SELL label immediately on the candle that confirmed the new level.
After Candle Close: Waits for the confirmation candle to close and prints the signal on the next candle, providing an extra layer of validation.
Strict One Signal Per Level Rule: The script features built-in logic that guarantees only one signal will ever be triggered per new structural level, completely eliminating label clutter and overlapping signals.
How to Use It (Trading Strategy)
Support & BUY Signals: Look for green BUY labels after the market prints a fresh support line. This indicates that momentum has shifted upwards from an oversold structural area.
Resistance & SELL Signals: Look for red SELL labels when price prints a fresh resistance line. This indicates institutional selling pressure in an overbought area.
Breakouts & Re-tests: The drawn lines stay on the chart, allowing you to monitor future re-tests of these adaptive zones.
Disclaimer
Past performance does not guarantee future results. This indicator is meant to be used as a supportive tool alongside your own risk management and trading plan.
Adaptive Support & Resistance Pro is a dynamic technical analysis tool designed to automatically identify, calculate, and plot key Support and Resistance (S/R) levels on your chart. Unlike traditional pivot-based indicators, this script uses a hybrid approach combining Momentum, Relative Strength, and Volatility filters to pinpoint institutional supply and demand zones.
To ensure professional-grade execution, the script is fully optimized to prevent repainting. It operates strictly in real-time, aligning historical signals with the exact moments these key levels were formed.
How It Works (The Engine)
The indicator calculates its levels based on three core components:
Chande Momentum Oscillator (CMO) via HMA: It analyzes the rate of change between two Hull Moving Averages (HMA) of different periods to detect strong shifts in market momentum.
Relative Strength Index (RSI): A 9-period RSI filters out minor market noise, ensuring that support levels are only tracked in oversold conditions (
RSI < 25$) and resistance levels in overbought conditions (RSI > 75$).Legacy Close Pivots: The script analyzes extreme high/low deviations over a specific lookback period to establish the structural price floor or ceiling.
When all three conditions align, a new Support or Resistance price level is established.
Key Features & Settings
Multi-Timeframe (S/R Timeframe): You can plot S/R levels from higher timeframes (e.g., Daily or 4-Hour) directly onto your lower timeframe execution chart (e.g., 15-minute) for top-down analysis.
Signal Trigger Modes: Under the settings, you can choose how signals are displayed:
On Candle Close: Displays a BUY or SELL label immediately on the candle that confirmed the new level.
After Candle Close: Waits for the confirmation candle to close and prints the signal on the next candle, providing an extra layer of validation.
Strict One Signal Per Level Rule: The script features built-in logic that guarantees only one signal will ever be triggered per new structural level, completely eliminating label clutter and overlapping signals.
How to Use It (Trading Strategy)
Support & BUY Signals: Look for green BUY labels after the market prints a fresh support line. This indicates that momentum has shifted upwards from an oversold structural area.
Resistance & SELL Signals: Look for red SELL labels when price prints a fresh resistance line. This indicates institutional selling pressure in an overbought area.
Breakouts & Re-tests: The drawn lines stay on the chart, allowing you to monitor future re-tests of these adaptive zones.
Disclaimer
Past performance does not guarantee future results. This indicator is meant to be used as a supportive tool alongside your own risk management and trading plan.
Skrip open-source
Dengan semangat TradingView yang sesungguhnya, pembuat skrip ini telah menjadikannya sebagai sumber terbuka, sehingga para trader dapat meninjau dan memverifikasi fungsinya. Salut untuk penulisnya! Meskipun Anda dapat menggunakannya secara gratis, perlu diingat bahwa penerbitan ulang kode ini tunduk pada Tata Tertib kami.

Free telegram channel t.me/alexmasterforex
Pernyataan Penyangkalan
Informasi dan publikasi ini tidak dimaksudkan, dan bukan merupakan, saran atau rekomendasi keuangan, investasi, trading, atau jenis lainnya yang diberikan atau didukung oleh TradingView. Baca selengkapnya di Ketentuan Penggunaan.
Skrip open-source
Dengan semangat TradingView yang sesungguhnya, pembuat skrip ini telah menjadikannya sebagai sumber terbuka, sehingga para trader dapat meninjau dan memverifikasi fungsinya. Salut untuk penulisnya! Meskipun Anda dapat menggunakannya secara gratis, perlu diingat bahwa penerbitan ulang kode ini tunduk pada Tata Tertib kami.
Free telegram channel t.me/alexmasterforex
Pernyataan Penyangkalan
Informasi dan publikasi ini tidak dimaksudkan, dan bukan merupakan, saran atau rekomendasi keuangan, investasi, trading, atau jenis lainnya yang diberikan atau didukung oleh TradingView. Baca selengkapnya di Ketentuan Penggunaan.