Hawkes Vol-Expansion Detector [UFVG]
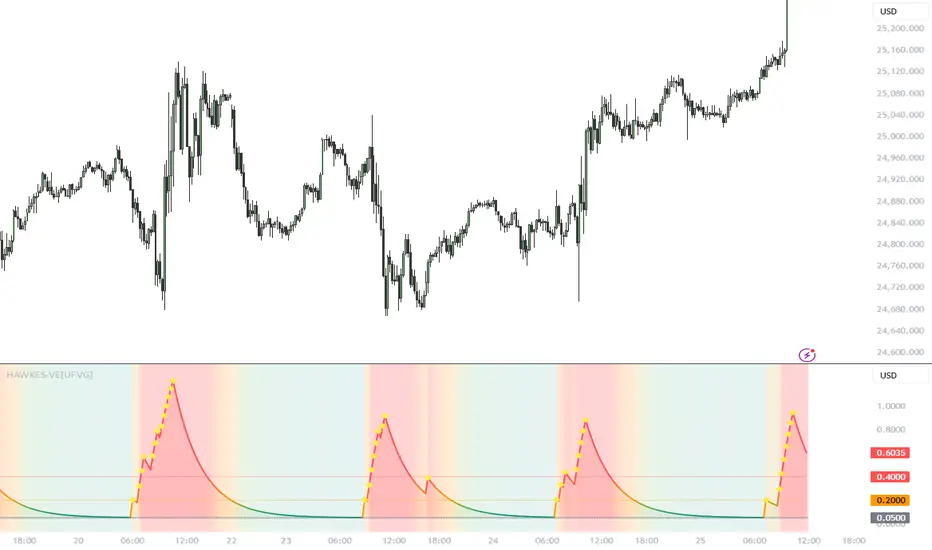
Financial markets exhibit "volatility clustering" large moves tend to be followed by large moves, and quiet periods by quiet periods. The Hawkes Vol-Expansion Detector is built on the premise that market volume and volatility are self-exciting. When a significant market shock occurs, it temporarily increases the probability of further shocks before eventually decaying back to a baseline level.
By tracking volume anomalies and ATR expansions through a mathematical framework known as a Hawkes Process, this indicator visualizes the buildup and decay of market intensity, giving traders a heads-up before prolonged volatility expansions.
The Mathematics: How It Works
At the core of this indicator is a discretized version of the Hawkes Process. It calculates the current market intensity (λ) at time t based on a constant baseline, the decayed intensity from previous periods, and new market shocks.
The exact formula calculated under the hood is:
λ_t = μ + (λ_{t-1} - μ) * e^(-β) + α * X_t
Here is what these variables represent in the indicator:
λ_t (Current Intensity): The total plotted excitation level of the market.
μ (Baseline Intensity, mu_eff): The constant, underlying rate of market activity when no shocks are occurring.
α (Excitation Jump, alpha_eff): The exact amount the intensity spikes when a new volume shock is detected.
β (Decay Rate, beta_eff): The speed at which the excess market excitement fades back to the baseline.
X_t (Shock Event): A boolean value (1 or 0) indicating if a volume/price shock occurred on the current candle.
Additionally, the indicator utilizes the Branching Ratio (n), defined mathematically as:
n = α / β
In quantitative modeling, if n < 1, the process is stable (shocks eventually die out). If n >= 1, the process becomes unstable and explodes. The auto-tuned parameters in this script are specifically designed to keep the branching ratio stable while remaining highly responsive to expansions.
Volume Shock Detection (X_t)
The indicator does not just fire the excitation parameter (α) on every candle. A "Shock Event" (X_t = 1) strictly occurs only when both of the following conditions are met:
Volume Z-Score: The current volume must exceed its rolling moving average by a specific standard deviation threshold.
Z = (V_t - μ_V) / σ_V
ATR Displacement: High volume without price movement is often absorption. To confirm a valid shock, the candle's high-to-low range must exceed a multiplier of the Average True Range (ATR).
Dynamic Timeframe Auto-Tuning
Different timeframes have different noise profiles. A 5-minute chart has erratic, frequent spikes, while a Daily chart's volume is more sustained. If the "Auto-adjust by Timeframe" setting is active, the script dynamically adjusts μ, α, β, and the Z-score threshold to fit the timeframe:
Low Timeframes (<= 5m): Uses a higher Z-score requirement (Z=2.0) to filter out intraday noise, with a faster decay rate.
Mid Timeframes (15m - 1H): Uses balanced parameters (Z=1.8).
High Timeframes (Daily+): Lowers the Z-score threshold (Z=1.5) but uses a higher baseline and slower decay, reflecting the longer-lasting impact of macro-level daily shocks.
How to Read the Chart
The indicator plots the λ_t line against a flat baseline (μ).
Yellow Diamonds: Mark the exact candles where a volume/ATR shock (X_t = 1) occurred.
Teal/Green Zones (Calm): The intensity is near baseline. The market is consolidating or ranging.
Orange Zones (Elevated): Multiple shocks are stacking up. The decay rate (β) cannot keep up with the new excitations (α). This is your warning that a trend or volatility expansion is initiating.
Red Zones (Expansion): The market is in a full volatility expansion. Excess intensity has crossed the critical threshold. Look for momentum continuation or impending climax depending on price action.
By tracking volume anomalies and ATR expansions through a mathematical framework known as a Hawkes Process, this indicator visualizes the buildup and decay of market intensity, giving traders a heads-up before prolonged volatility expansions.
The Mathematics: How It Works
At the core of this indicator is a discretized version of the Hawkes Process. It calculates the current market intensity (λ) at time t based on a constant baseline, the decayed intensity from previous periods, and new market shocks.
The exact formula calculated under the hood is:
λ_t = μ + (λ_{t-1} - μ) * e^(-β) + α * X_t
Here is what these variables represent in the indicator:
λ_t (Current Intensity): The total plotted excitation level of the market.
μ (Baseline Intensity, mu_eff): The constant, underlying rate of market activity when no shocks are occurring.
α (Excitation Jump, alpha_eff): The exact amount the intensity spikes when a new volume shock is detected.
β (Decay Rate, beta_eff): The speed at which the excess market excitement fades back to the baseline.
X_t (Shock Event): A boolean value (1 or 0) indicating if a volume/price shock occurred on the current candle.
Additionally, the indicator utilizes the Branching Ratio (n), defined mathematically as:
n = α / β
In quantitative modeling, if n < 1, the process is stable (shocks eventually die out). If n >= 1, the process becomes unstable and explodes. The auto-tuned parameters in this script are specifically designed to keep the branching ratio stable while remaining highly responsive to expansions.
Volume Shock Detection (X_t)
The indicator does not just fire the excitation parameter (α) on every candle. A "Shock Event" (X_t = 1) strictly occurs only when both of the following conditions are met:
Volume Z-Score: The current volume must exceed its rolling moving average by a specific standard deviation threshold.
Z = (V_t - μ_V) / σ_V
ATR Displacement: High volume without price movement is often absorption. To confirm a valid shock, the candle's high-to-low range must exceed a multiplier of the Average True Range (ATR).
Dynamic Timeframe Auto-Tuning
Different timeframes have different noise profiles. A 5-minute chart has erratic, frequent spikes, while a Daily chart's volume is more sustained. If the "Auto-adjust by Timeframe" setting is active, the script dynamically adjusts μ, α, β, and the Z-score threshold to fit the timeframe:
Low Timeframes (<= 5m): Uses a higher Z-score requirement (Z=2.0) to filter out intraday noise, with a faster decay rate.
Mid Timeframes (15m - 1H): Uses balanced parameters (Z=1.8).
High Timeframes (Daily+): Lowers the Z-score threshold (Z=1.5) but uses a higher baseline and slower decay, reflecting the longer-lasting impact of macro-level daily shocks.
How to Read the Chart
The indicator plots the λ_t line against a flat baseline (μ).
Yellow Diamonds: Mark the exact candles where a volume/ATR shock (X_t = 1) occurred.
Teal/Green Zones (Calm): The intensity is near baseline. The market is consolidating or ranging.
Orange Zones (Elevated): Multiple shocks are stacking up. The decay rate (β) cannot keep up with the new excitations (α). This is your warning that a trend or volatility expansion is initiating.
Red Zones (Expansion): The market is in a full volatility expansion. Excess intensity has crossed the critical threshold. Look for momentum continuation or impending climax depending on price action.

Pernyataan Penyangkalan
Informasi dan publikasi ini tidak dimaksudkan, dan bukan merupakan, saran atau rekomendasi keuangan, investasi, trading, atau jenis lainnya yang diberikan atau didukung oleh TradingView. Baca selengkapnya di Ketentuan Penggunaan.
Pernyataan Penyangkalan
Informasi dan publikasi ini tidak dimaksudkan, dan bukan merupakan, saran atau rekomendasi keuangan, investasi, trading, atau jenis lainnya yang diberikan atau didukung oleh TradingView. Baca selengkapnya di Ketentuan Penggunaan.