OPEN-SOURCE SCRIPT
Diupdate Quantum Master Control Panel [HUD]
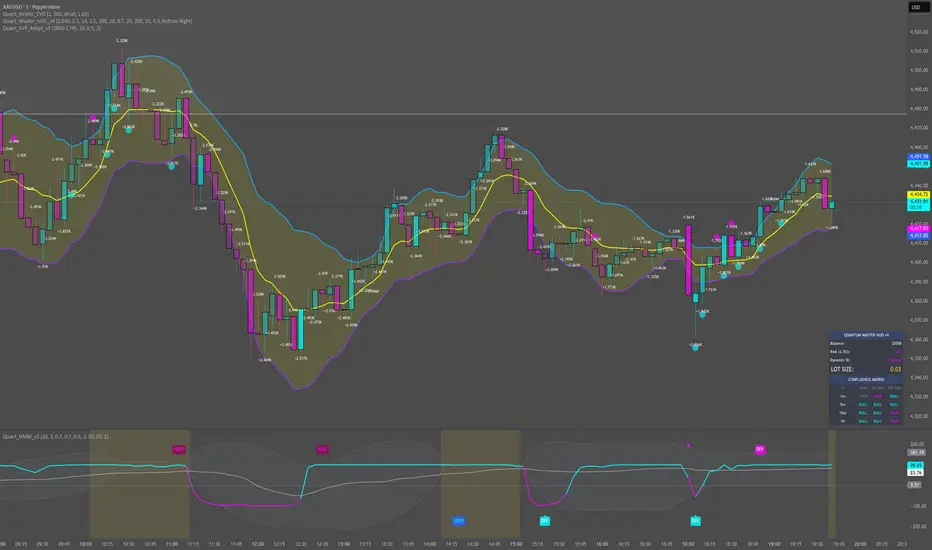
Quantum Master Control Panel [MTF Confluence + Risk]
Overview:
Professional execution requires two things: perfect multi-timeframe alignment and mathematically flawless risk management. If you are constantly clicking between the 1m, 5m, 15m, and 1h charts to check your momentum, or fumbling with a web calculator to figure out your lot size, you are losing precious seconds and bleeding execution edge.
The Quantum Master Control Panel solves this by fusing a dynamic, volatility-adjusted risk calculator and a Multi-Timeframe (MTF) confluence heatmap into a single, sleek Heads-Up Display (HUD) that pins directly to your main chart.
Core Features:
How to Trade It:
Wait for a micro-trigger on your execution timeframe (like a volume spike or pressure signal). Before you execute, glance at the MTF Matrix. If the RCI and Macro states are aligned (glowing entirely Cyan for long, or Fuchsia for short), your trade has macro backing. Look at the bottom row of the HUD, punch that exact Lot Size into your broker, and set your Stop Loss to the exact Dynamic SL points provided.
Overview:
Professional execution requires two things: perfect multi-timeframe alignment and mathematically flawless risk management. If you are constantly clicking between the 1m, 5m, 15m, and 1h charts to check your momentum, or fumbling with a web calculator to figure out your lot size, you are losing precious seconds and bleeding execution edge.
The Quantum Master Control Panel solves this by fusing a dynamic, volatility-adjusted risk calculator and a Multi-Timeframe (MTF) confluence heatmap into a single, sleek Heads-Up Display (HUD) that pins directly to your main chart.
Core Features:
- Dynamic Volatility Risk Calculator: Never use a static stop loss again. The HUD reads the current Average True Range (ATR) to calculate a dynamic stop loss distance. It then takes your exact account balance and risk percentage to output the exact lot size you need to execute.
- Built-in MTF RCI Heatmap: The dashboard silently runs the Rank Correlation Index (RCI) across the 1m, 5m, 15m, and 1h timeframes, providing a real-time matrix of institutional momentum.
- Macro Trend Alignment: The HUD instantly tells you if the current price is above or below the 200 EMA across all four major timeframes, ensuring you never take a scalp against the macro tide.
How to Trade It:
Wait for a micro-trigger on your execution timeframe (like a volume spike or pressure signal). Before you execute, glance at the MTF Matrix. If the RCI and Macro states are aligned (glowing entirely Cyan for long, or Fuchsia for short), your trade has macro backing. Look at the bottom row of the HUD, punch that exact Lot Size into your broker, and set your Stop Loss to the exact Dynamic SL points provided.
Catatan Rilis
Quantum Master Control Panel v2 [HMM Confluence + Risk]Overview:
Standard multi-timeframe dashboards rely on lagging momentum oscillators that throw false signals the second the market enters consolidation. To execute with sniper precision, you need to know the actual probability of the current market regime.
The Quantum Master Control Panel v2 completely overhauls the traditional momentum heatmap by injecting an adaptive Hidden Markov Model (HMM). Combined with a dynamic, volatility-based risk calculator, this Heads-Up Display (HUD) gives you the exact macro context and position sizing you need without ever leaving your execution timeframe.
Core Features:
- Dynamic Volatility Risk Calculator: Automatically calculates your exact Lot Size and Stop Loss distance based on your account balance and the real-time Average True Range (ATR).
- MTF HMM Regime Heatmap: Silently runs a complex Bayesian probability matrix across the 1m, 5m, 15m, and 1h charts. It instantly categorizes the market into BULL, BEAR, or CHOP, keeping you out of the noise and only executing when the structural trend is aligned.
- Macro Trend Alignment: Cross-references the HMM probabilities with the 200 EMA to ensure you are always trading on the right side of the institutional flow.
How to Trade It:
When your 1m/5m execution chart flashes an entry trigger, glance at the HUD matrix. If the 15m and 1h rows show a trending HMM state (Cyan or Fuchsia), and your execution timeframe has just shifted out of "CHOP," you have the ultimate mathematical green light. Grab the calculated lot size from the top row and execute.
Catatan Rilis
Quantum Master Control Panel v3 [Confluence Matrix]Overview:
A profitable trading system doesn't just calculate risk; it cross-references the underlying mathematical probabilities with the physical market structure. The Quantum Master Control Panel v3 introduces a true multi-timeframe Confluence Matrix, combining Institutional Bayesian Probabilities with dynamic volatility-based risk management.
Core Features & Upgrades:
- The Confluence Matrix: Expands the multi-timeframe heatmap to cross-reference three distinct engines across the 1m, 5m, 15m, and 1h charts:
1. HMM Regime: Calculates the Bayesian probability of a Bull, Bear, or Chop state.
2. 20 SMA High/Low Channel: A physical volatility box that flags if price is breaking out or trapped "INSIDE" fair value.
3. Macro EMA Alignment: The 200 EMA baseline for macro-trend verification.
- Dynamic Risk Calculator: Instantly reads the current ATR, multiplies your stop loss distance, and calculates the exact lot size required to execute your strict percentage risk.
How to Trade It:
Wait for the matrix to align. If your 1m and 5m rows show "BULL" across the HMM, "BULL" on the 20 SMA (meaning price has physically broken out of the volatility box), and your macro timeframes agree, you have the ultimate structural and mathematical green light.
Catatan Rilis
Quantum Master Control Panel v4 [Power & Vacuum]Overview:
Institutional algorithms do not just read price; they read market efficiency and liquidity depth. If you are scalping without knowing when the order book is being pulled, you are flying blind into stop hunts.
The Quantum Master Control Panel v4 evolves the ultimate multi-timeframe dashboard by introducing real-time manipulation detection and kinetic efficiency tracking, ensuring you only execute when the institutional flow is genuine.
Core Engines & Upgrades:
- ⚠️ Volatility Vacuum Detection:\ Automatically calculates a rolling baseline of tick volume. If current volume violently drops below 30% of the average, it means high-frequency algorithms have pulled their limit orders ahead of news or a manipulation sweep. The HUD instantly flashes blood red, warning you to stay out of the market.
- ⚡ The Power Move Matrix (ER): The HMM heatmap has been upgraded with Kaufman’s Efficiency Ratio. If a trend becomes highly efficient (moving in a straight line with zero pullbacks), the matrix upgrades the standard "BULL/BEAR" signal to a neon "⚡ P-BULL" or "⚡ P-BEAR", letting you know a massive momentum leg is currently underway.
- The Structural Confluence Matrix: Continues to cross-reference the adaptive HMM Bayesian probabilities with a physical 20 SMA volatility box and the 200 EMA macro trend across the 1m, 5m, 15m, and 1h charts simultaneously.
- Dynamic Risk Calculator: Automatically calculates your precise lot size and dynamic stop loss based on your account balance and the real-time Average True Range (ATR).
How to Trade It:
When the HUD flashes Red, take your hands off the mouse—liquidity is gone and a spike is coming. When the coast is clear, wait for your execution timeframe to light up with a Neon ⚡ P-BULL alongside macro timeframe alignment, grab the lot size from the top panel, and ride the institutional wave.
Skrip open-source
Dengan semangat TradingView yang sesungguhnya, pembuat skrip ini telah menjadikannya sebagai sumber terbuka, sehingga para trader dapat meninjau dan memverifikasi fungsinya. Salut untuk penulisnya! Meskipun Anda dapat menggunakannya secara gratis, perlu diingat bahwa penerbitan ulang kode ini tunduk pada Tata Tertib kami.

Pernyataan Penyangkalan
Informasi dan publikasi ini tidak dimaksudkan, dan bukan merupakan, saran atau rekomendasi keuangan, investasi, trading, atau jenis lainnya yang diberikan atau didukung oleh TradingView. Baca selengkapnya di Ketentuan Penggunaan.
Skrip open-source
Dengan semangat TradingView yang sesungguhnya, pembuat skrip ini telah menjadikannya sebagai sumber terbuka, sehingga para trader dapat meninjau dan memverifikasi fungsinya. Salut untuk penulisnya! Meskipun Anda dapat menggunakannya secara gratis, perlu diingat bahwa penerbitan ulang kode ini tunduk pada Tata Tertib kami.
Pernyataan Penyangkalan
Informasi dan publikasi ini tidak dimaksudkan, dan bukan merupakan, saran atau rekomendasi keuangan, investasi, trading, atau jenis lainnya yang diberikan atau didukung oleh TradingView. Baca selengkapnya di Ketentuan Penggunaan.