OPEN-SOURCE SCRIPT
Diupdate RSI-50 Step Line
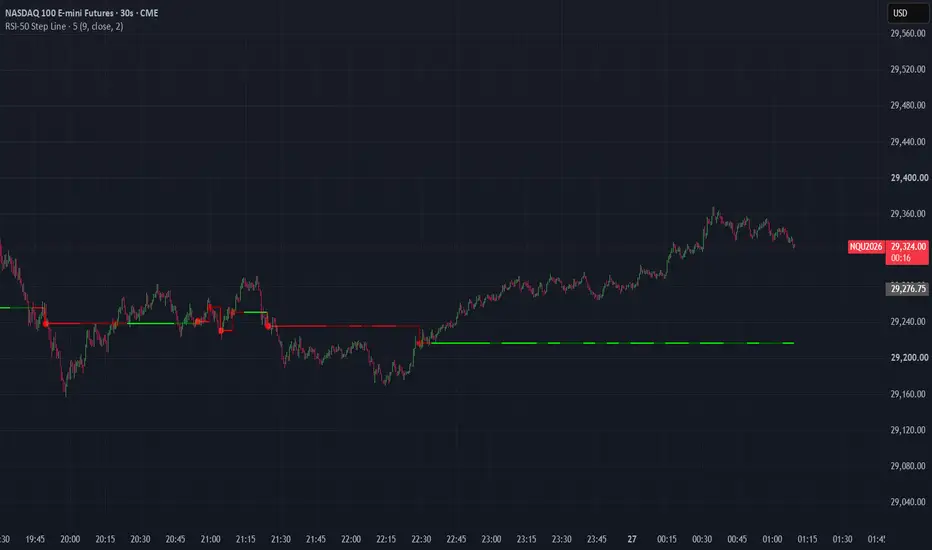
RSI-50 Step Line — Momentum-Adaptive Price Reference:
This indicator plots a dynamic horizontal reference line that tracks price at the exact moment RSI crosses the 50 level — giving traders a live, self-adjusting benchmark for where momentum shifted from bullish to bearish, or vice versa.
How the line is built? :
Every time RSI (default length 9, source close — both adjustable in settings) crosses the 50 level in either direction, the line "steps" to whatever price closed at that exact bar, then holds flat until the next RSI-50 cross. The result is a stair-step price ladder built entirely from momentum inflection points, rather than fixed lookback windows or manually-drawn pivots.
Because earlier steps are never deleted or redrawn, the indicator leaves a running visual history on the chart. When price later revisits an older step, you can see directly whether it's testing a level that originally marked a genuine momentum shift — which can carry more weight than an arbitrary support/resistance line.
Cross markers (the dots):
At each bar where RSI crosses 50 and the line steps to a new level, a small circle marker is plotted. This flags every step point clearly, which matters on charts where flat segments can otherwise blend together. The dot is colored using the same 4-state logic as the line (below), but it's frozen at the exact bar of the cross — so it shows the momentum condition that triggered that specific level, even if the line's color later changes as price and RSI continue to evolve past that point. Comparing a dot's shade to the segment that follows it is a quick way to see whether a level was born from strong or weak momentum.
Color logic (4 states):
The line and its dots are shaded based on two live conditions: price's position relative to the current step, and RSI's immediate direction (rising or falling bar-to-bar).
Light green — price above the level, RSI rising → bullish, momentum strengthening
Dark green — price above the level, RSI falling → bullish, but momentum fading
Light red — price below the level, RSI falling → bearish, momentum strengthening
Dark red — price below the level, RSI rising → bearish, but momentum recovering
The dark shades are not signals on their own — they're a visual cue that the current side of the trade may be losing conviction, which some traders use as a prompt to tighten risk or watch more closely for a reversal, rather than as an entry/exit trigger.
What this indicator does and does not do? :
This tool identifies and colors momentum-derived price levels; it does not generate buy/sell signals, predict future price movement, or account for risk management. All settings (RSI length, RSI source, and each of the four colors) are user-adjustable in the inputs panel. As with any indicator, it should be used alongside broader market context and a trader's own risk framework rather than in isolation.
This indicator plots a dynamic horizontal reference line that tracks price at the exact moment RSI crosses the 50 level — giving traders a live, self-adjusting benchmark for where momentum shifted from bullish to bearish, or vice versa.
How the line is built? :
Every time RSI (default length 9, source close — both adjustable in settings) crosses the 50 level in either direction, the line "steps" to whatever price closed at that exact bar, then holds flat until the next RSI-50 cross. The result is a stair-step price ladder built entirely from momentum inflection points, rather than fixed lookback windows or manually-drawn pivots.
Because earlier steps are never deleted or redrawn, the indicator leaves a running visual history on the chart. When price later revisits an older step, you can see directly whether it's testing a level that originally marked a genuine momentum shift — which can carry more weight than an arbitrary support/resistance line.
Cross markers (the dots):
At each bar where RSI crosses 50 and the line steps to a new level, a small circle marker is plotted. This flags every step point clearly, which matters on charts where flat segments can otherwise blend together. The dot is colored using the same 4-state logic as the line (below), but it's frozen at the exact bar of the cross — so it shows the momentum condition that triggered that specific level, even if the line's color later changes as price and RSI continue to evolve past that point. Comparing a dot's shade to the segment that follows it is a quick way to see whether a level was born from strong or weak momentum.
Color logic (4 states):
The line and its dots are shaded based on two live conditions: price's position relative to the current step, and RSI's immediate direction (rising or falling bar-to-bar).
Light green — price above the level, RSI rising → bullish, momentum strengthening
Dark green — price above the level, RSI falling → bullish, but momentum fading
Light red — price below the level, RSI falling → bearish, momentum strengthening
Dark red — price below the level, RSI rising → bearish, but momentum recovering
The dark shades are not signals on their own — they're a visual cue that the current side of the trade may be losing conviction, which some traders use as a prompt to tighten risk or watch more closely for a reversal, rather than as an entry/exit trigger.
What this indicator does and does not do? :
This tool identifies and colors momentum-derived price levels; it does not generate buy/sell signals, predict future price movement, or account for risk management. All settings (RSI length, RSI source, and each of the four colors) are user-adjustable in the inputs panel. As with any indicator, it should be used alongside broader market context and a trader's own risk framework rather than in isolation.
Catatan Rilis
Added an option to change timeframe at the bottom of the input section. This helps plotting higher tmf level on chart so that entry into trade in smaller timeframe becomes crisp.Skrip open-source
Dengan semangat TradingView yang sesungguhnya, pembuat skrip ini telah menjadikannya sebagai sumber terbuka, sehingga para trader dapat meninjau dan memverifikasi fungsinya. Salut untuk penulisnya! Meskipun Anda dapat menggunakannya secara gratis, perlu diingat bahwa penerbitan ulang kode ini tunduk pada Tata Tertib kami.

Pernyataan Penyangkalan
Informasi dan publikasi ini tidak dimaksudkan, dan bukan merupakan, saran atau rekomendasi keuangan, investasi, trading, atau jenis lainnya yang diberikan atau didukung oleh TradingView. Baca selengkapnya di Ketentuan Penggunaan.
Skrip open-source
Dengan semangat TradingView yang sesungguhnya, pembuat skrip ini telah menjadikannya sebagai sumber terbuka, sehingga para trader dapat meninjau dan memverifikasi fungsinya. Salut untuk penulisnya! Meskipun Anda dapat menggunakannya secara gratis, perlu diingat bahwa penerbitan ulang kode ini tunduk pada Tata Tertib kami.
Pernyataan Penyangkalan
Informasi dan publikasi ini tidak dimaksudkan, dan bukan merupakan, saran atau rekomendasi keuangan, investasi, trading, atau jenis lainnya yang diberikan atau didukung oleh TradingView. Baca selengkapnya di Ketentuan Penggunaan.