Percentile Momentum | NAL
Momentum is not only about how far price has moved. It is also about how far price has moved relative to its own historical distribution.
Percentile Momentum is a distribution-based momentum oscillator that replaces conventional price-change measurements with statistical displacement from a rolling price percentile.
Traditional momentum indicators typically measure the difference between current and historical prices. This approach treats the observation period as the primary reference for determining momentum.
Percentile Momentum introduces a different reference: the price level associated with a selected percentile of the recent price distribution.
The indicator then evaluates that displacement against its own historical percentile thresholds, creating a two-stage statistical framework for identifying directional market conditions.
The result is a momentum model whose reference price and directional boundaries both evolve with the market's underlying distribution.
1. Distribution-Referenced Momentum
The model begins by constructing a rolling empirical distribution of the selected price source.
A configurable percentile is extracted from this distribution using linear interpolation.
Pine Script®
The resulting momentum measurement represents the distance between the current source value and its historical percentile reference.
With the default 70th percentile, the reference corresponds to the price level at approximately the upper 30% of the observed distribution.
This produces a fundamentally different interpretation from traditional rate-of-change momentum:
Importantly, this is not a percentage-return oscillator or a conventional RSI calculation. Its values are expressed in the units of the selected price source.
2. Adaptive Momentum Percentiles
The second stage applies percentile analysis to the momentum series itself.
Rather than classifying directional conditions using fixed oscillator levels, the model continuously estimates the upper and lower boundaries of its recent momentum distribution.
Pine Script®
These boundaries adapt as the distribution of price displacement evolves.
The default configuration uses the 70th and 10th percentiles, establishing asymmetric directional requirements.
This distinction matters because the model does not assume that upward and downward momentum must be evaluated against identical statistical boundaries.
3. Directional Regime Classification
The final regime is determined by the interaction between current percentile momentum and its adaptive thresholds.
Pine Script®
This persistence mechanism prevents the indicator from immediately changing state whenever momentum temporarily returns toward the center of its distribution.
Instead, a new regime requires the relevant statistical threshold to be breached.
4. Why Percentile Momentum Is Different
The distinguishing feature is its dual application of percentile statistics.
The first percentile establishes where price stands relative to its historical distribution.
The second set of percentiles determines whether the resulting displacement is statistically elevated or depressed relative to its own recent behavior.
This separates two important questions:
A positive momentum reading does not automatically establish a bullish regime. The displacement must also exceed the applicable adaptive threshold and satisfy the price confirmation condition.
Likewise, a bearish regime reflects a sufficiently low momentum observation relative to its historical distribution, not necessarily a negative absolute return.
Visuals & Interpretation
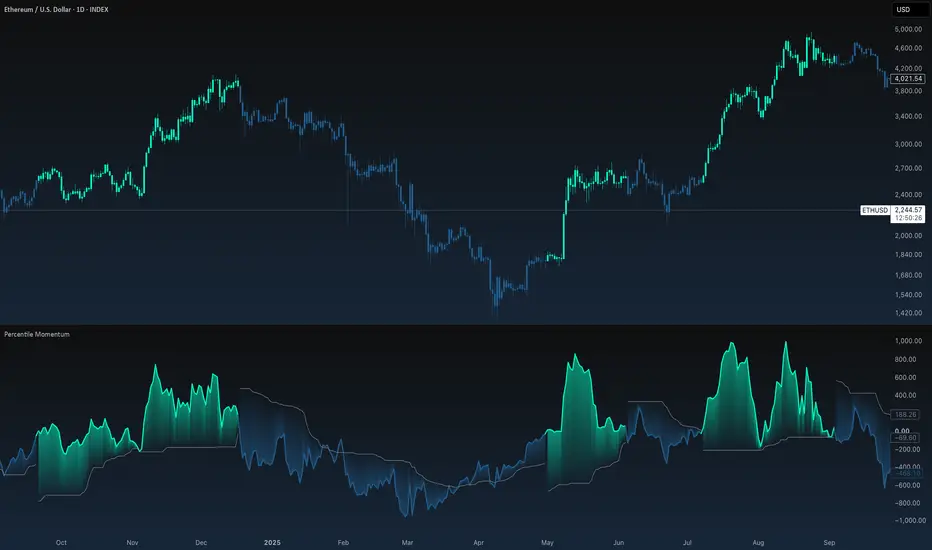
The primary oscillator displays percentile-referenced momentum, with its color determined by the prevailing directional state.
The visualization includes:
Practical Application
Percentile Momentum provides a statistical framework for examining relative price displacement, momentum expansion, distributional weakness, and directional regime persistence.
Its underlying premise is straightforward:
The significance of a price movement depends not only on its magnitude, but also on its relationship to the distribution from which it emerged.
By constructing both the momentum reference and its directional thresholds from rolling empirical distributions, the model offers an alternative perspective on momentum without depending on conventional fixed-period price differences or static oscillator boundaries.
Automated Alerts
Two built-in alerts identify confirmed directional transitions:
Both alert conditions require a confirmed bar and activate only when the directional state changes.
Configuration
Users can customize the source, statistical observation length, price percentile, upper momentum percentile, lower momentum percentile, and visual color scheme.
Percentile Momentum is a distribution-based momentum oscillator that replaces conventional price-change measurements with statistical displacement from a rolling price percentile.
Traditional momentum indicators typically measure the difference between current and historical prices. This approach treats the observation period as the primary reference for determining momentum.
Percentile Momentum introduces a different reference: the price level associated with a selected percentile of the recent price distribution.
The indicator then evaluates that displacement against its own historical percentile thresholds, creating a two-stage statistical framework for identifying directional market conditions.
The result is a momentum model whose reference price and directional boundaries both evolve with the market's underlying distribution.
1. Distribution-Referenced Momentum
The model begins by constructing a rolling empirical distribution of the selected price source.
A configurable percentile is extracted from this distribution using linear interpolation.
The resulting momentum measurement represents the distance between the current source value and its historical percentile reference.
With the default 70th percentile, the reference corresponds to the price level at approximately the upper 30% of the observed distribution.
This produces a fundamentally different interpretation from traditional rate-of-change momentum:
- Positive Momentum — the source is trading above its selected historical percentile reference.
- Negative Momentum — the source is trading below its selected historical percentile reference.
- Momentum Magnitude — measures the absolute price displacement from that statistical reference.
Importantly, this is not a percentage-return oscillator or a conventional RSI calculation. Its values are expressed in the units of the selected price source.
2. Adaptive Momentum Percentiles
The second stage applies percentile analysis to the momentum series itself.
Rather than classifying directional conditions using fixed oscillator levels, the model continuously estimates the upper and lower boundaries of its recent momentum distribution.
These boundaries adapt as the distribution of price displacement evolves.
- Upper Momentum Percentile — identifies unusually elevated momentum relative to recent observations.
- Lower Momentum Percentile — identifies comparatively weak or depressed momentum.
The default configuration uses the 70th and 10th percentiles, establishing asymmetric directional requirements.
This distinction matters because the model does not assume that upward and downward momentum must be evaluated against identical statistical boundaries.
3. Directional Regime Classification
The final regime is determined by the interaction between current percentile momentum and its adaptive thresholds.
- Bullish Regime — momentum exceeds its upper historical percentile, while the closing price also remains above the percentile-derived price reference.
- Bearish Regime — momentum falls below its lower historical percentile.
- Regime Persistence — when neither condition is satisfied, the model retains its previous directional classification.
This persistence mechanism prevents the indicator from immediately changing state whenever momentum temporarily returns toward the center of its distribution.
Instead, a new regime requires the relevant statistical threshold to be breached.
4. Why Percentile Momentum Is Different
The distinguishing feature is its dual application of percentile statistics.
The first percentile establishes where price stands relative to its historical distribution.
The second set of percentiles determines whether the resulting displacement is statistically elevated or depressed relative to its own recent behavior.
This separates two important questions:
- Price Location — how far is price from a distribution-derived reference level?
- Momentum Significance — how unusual is that displacement compared with recent momentum observations?
A positive momentum reading does not automatically establish a bullish regime. The displacement must also exceed the applicable adaptive threshold and satisfy the price confirmation condition.
Likewise, a bearish regime reflects a sufficiently low momentum observation relative to its historical distribution, not necessarily a negative absolute return.
Visuals & Interpretation
The primary oscillator displays percentile-referenced momentum, with its color determined by the prevailing directional state.
The visualization includes:
- Percentile Momentum Curve — continuously measures price displacement from the selected percentile reference.
- Adaptive Momentum Bands — dynamically calculated upper and lower percentile boundaries.
- Directional Gradients — highlight the relationship between current momentum and the opposing regime boundary.
- Persistent Trend Colors — distinguish bullish and bearish classifications.
- Trend-Colored Candles — project the prevailing regime onto the main price chart.
- Three Color Presets — Standard, Nordic, and Simple.
Practical Application
Percentile Momentum provides a statistical framework for examining relative price displacement, momentum expansion, distributional weakness, and directional regime persistence.
Its underlying premise is straightforward:
The significance of a price movement depends not only on its magnitude, but also on its relationship to the distribution from which it emerged.
By constructing both the momentum reference and its directional thresholds from rolling empirical distributions, the model offers an alternative perspective on momentum without depending on conventional fixed-period price differences or static oscillator boundaries.
Automated Alerts
Two built-in alerts identify confirmed directional transitions:
- Bullish Transition — triggers when the model establishes a new bullish regime.
- Bearish Transition — triggers when the model establishes a new bearish regime.
Both alert conditions require a confirmed bar and activate only when the directional state changes.
Configuration
Users can customize the source, statistical observation length, price percentile, upper momentum percentile, lower momentum percentile, and visual color scheme.

🔵 Access our best trading & investing tools, get a 30-day free trial today: whop.com/nordic-alpha-lab/
Pernyataan Penyangkalan
Informasi dan publikasi ini tidak dimaksudkan, dan bukan merupakan, saran atau rekomendasi keuangan, investasi, trading, atau jenis lainnya yang diberikan atau didukung oleh TradingView. Baca selengkapnya di Ketentuan Penggunaan.
🔵 Access our best trading & investing tools, get a 30-day free trial today: whop.com/nordic-alpha-lab/
Pernyataan Penyangkalan
Informasi dan publikasi ini tidak dimaksudkan, dan bukan merupakan, saran atau rekomendasi keuangan, investasi, trading, atau jenis lainnya yang diberikan atau didukung oleh TradingView. Baca selengkapnya di Ketentuan Penggunaan.