OPEN-SOURCE SCRIPT
BTM - Volume Profile + Volatility
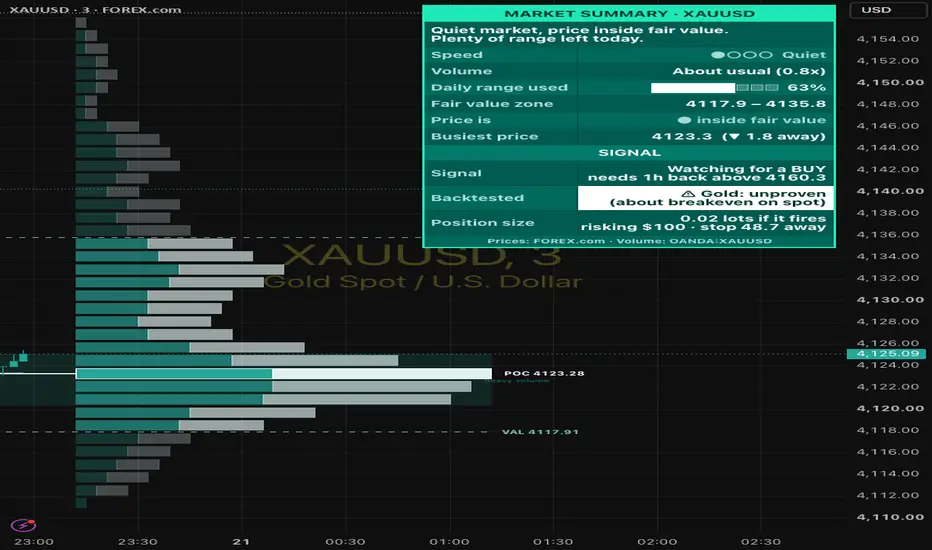
VP+VOL puts a session volume profile, a volatility read-out and one backtested trade setup on a single chart, with a dashboard that explains each reading in plain English. It works on any symbol and timeframe, including spot and CFD feeds that publish no volume, such as FOREX.com.
WHY VOLUME AND VOLATILITY TOGETHER
The volume profile shows where the market has done most of its business: the levels price tends to stall at or return to. Volatility shows how far price is likely to travel and how much room a stop needs. The signal uses both: profile levels for the entry and target, the session's range plus an ATR buffer for the stop, and the position size is worked out from that stop.
VOLUME PROFILE
• Built per session (Day, Week or a custom UK session) or over a fixed number of bars.
• POC (busiest price), 70% value area (VAH / VAL) and the buy / sell split of each row.
• Intrabar precision: each candle's volume is placed where price actually traded inside it, using lower-timeframe data.
• Developing POC, previous session POC / VAH / VAL, last week's POC / VAH / VAL, and naked POCs (earlier POCs price hasn't revisited).
• Heavy and thin volume zones shaded inside the profile. Price often stalls in heavy zones and moves quickly through thin ones.
• Only the current levels are drawn, each labelled with its name and price. Past levels appear if you turn on Show Level History.
VOLUME ON FEEDS WITHOUT VOLUME
Prices always come from your chart. If your broker publishes no volume, the script borrows tick volume for the same market from another feed: the same ticker on OANDA for FX and metals, OANDA's name for indices and commodities (NAS100 → NAS100USD, GER40 → DE30EUR, USOIL → WTICOUSD), or Coinbase for crypto. You can also pick any symbol yourself, such as a futures contract for real exchange volume. The dashboard footer shows which feed is in use.
VOLATILITY
• Speed: ATR percentile over the last 200 candles, shown as Quiet, Normal, Fast or Very fast.
• Candle size and volume compared with the usual for the same time of day (UK clock), so a quiet Asian hour and the London open are each judged against their own norm.
• Expansion or contraction (fast vs slow ATR), annualised historical volatility, daily range used against the average daily range, and an effort-vs-result read (absorption, thin move).
THE SIGNAL: 80% RULE
BUY when a session opens below the previous session's value area and closes then hold back inside it for the acceptance time (60 minutes by default). Target: the previous VAH. Stop: below the session low, plus 0.1 ATR. SELL is the mirror image. There is at most one trade per session, and it exits at the target, the stop or the end of the session. Signals are confirmed on the candle's close and enter on the next candle's open, with no look-ahead.
HOW IT WAS TESTED
The rules were fixed before testing. They were tested on 1h data with spread and commission included, and every result was split into two halves to check it held in both.
• Nasdaq 100: held up on futures (profit factor 1.59 over 144 trades, May 2024 to October 2026) and on CFD prices (1.47 with tick volume, 1.70 with futures volume), and was positive in both halves each time. The edge is small: about +0.1 to +0.2R per trade before slippage.
• Gold: strong on futures data but about breakeven on spot gold, so gold signals are unproven.
• Other markets and timeframes: not tested.
The dashboard's Backtested row says which of these applies to the chart you have open. Pro mode shows how the signals have done on your own chart's history.
Three common filters were tried and left out because each made Nasdaq worse: skipping days whose range is used up, trading London and New York hours only, and skipping extreme volatility.
ALERTS
Create an alert on this indicator and choose "Any alert() function call" to receive:
• Setup forming: the moment price trades back inside the previous value area. On 1h tests, 83 to 88% of these warnings were followed by a signal, typically about 55 minutes later.
• BUY / SELL: entry, stop, target, reward-to-risk, position size and the tested status for that market.
• Trade closed: stop, target or session end, with the result in R.
Separate alert conditions are also available for POC and value-area crosses, volatility changes and volume spikes.
POSITION SIZE
Enter your account size, risk per trade and account currency. The dashboard shows the lots that would lose your risk amount if the stop is hit, rounded down. While a setup is building, it sizes from where the signal would trigger. Lot sizes differ between brokers, so check one against your broker's order ticket and set Units per Lot if it's off.
DASHBOARD
Simple: a plain-English summary for beginners. Pro: every reading. Mini: signal, speed and price only, for phones. Hover over any row for an explanation.
HOW TO USE
1. Add it to a 1h chart for the tested setup. The profile and volatility readings work on any timeframe.
2. Under Position Size, set your account size, risk % and account currency.
3. Create an alert with "Any alert() function call".
4. When a BUY or SELL fires, check the size on your broker's order ticket before placing the trade.
LIMITATIONS
• Borrowed volume on spot and CFD feeds is tick volume, which stands in for real volume.
• History older than TradingView's intrabar limit is profiled from each candle's range.
• The edge is small. Spreads and slippage can remove it, and past results don't guarantee future ones.
This script is for education and analysis only. It is not financial advice. Trade at your own risk.
Skrip open-source
Dengan semangat TradingView yang sesungguhnya, pembuat skrip ini telah menjadikannya sebagai sumber terbuka, sehingga para trader dapat meninjau dan memverifikasi fungsinya. Salut untuk penulisnya! Meskipun Anda dapat menggunakannya secara gratis, perlu diingat bahwa penerbitan ulang kode ini tunduk pada Tata Tertib kami.

Pernyataan Penyangkalan
Informasi dan publikasi ini tidak dimaksudkan, dan bukan merupakan, saran atau rekomendasi keuangan, investasi, trading, atau jenis lainnya yang diberikan atau didukung oleh TradingView. Baca selengkapnya di Ketentuan Penggunaan.
Skrip open-source
Dengan semangat TradingView yang sesungguhnya, pembuat skrip ini telah menjadikannya sebagai sumber terbuka, sehingga para trader dapat meninjau dan memverifikasi fungsinya. Salut untuk penulisnya! Meskipun Anda dapat menggunakannya secara gratis, perlu diingat bahwa penerbitan ulang kode ini tunduk pada Tata Tertib kami.
Pernyataan Penyangkalan
Informasi dan publikasi ini tidak dimaksudkan, dan bukan merupakan, saran atau rekomendasi keuangan, investasi, trading, atau jenis lainnya yang diberikan atau didukung oleh TradingView. Baca selengkapnya di Ketentuan Penggunaan.