OPEN-SOURCE SCRIPT
Market Condition [ThetaLoop]
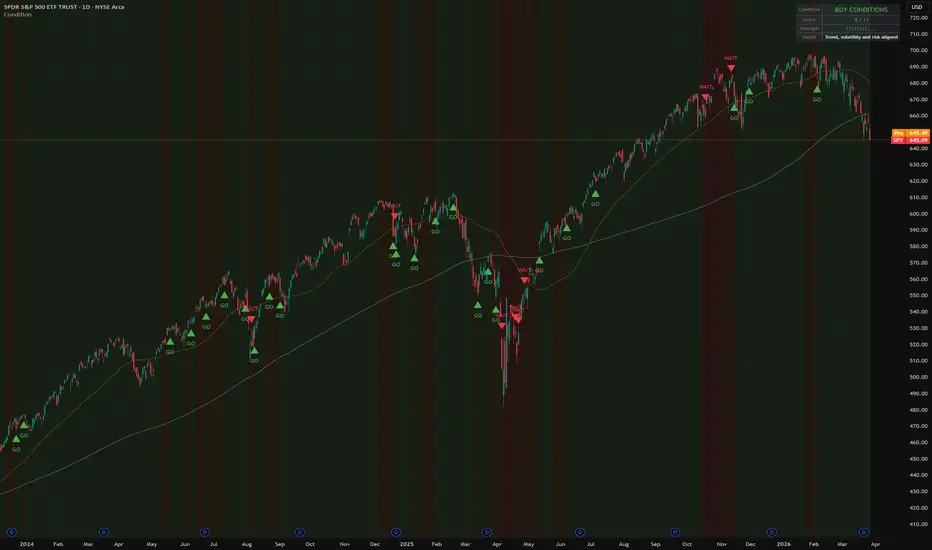
Should you buy today or wait?
That is the only question this indicator answers. Green means conditions are favorable. Red means they are not. Yellow means patience might pay off.
No complicated settings. No confusing numbers. The chart background changes color and arrows appear when conditions shift. If you want to know what is happening under the hood, the info box in the corner shows the score. If you do not care about the details, just follow the colors.
How it works (the simple version)
The indicator checks eight different things simultaneously and combines them into a single score from 0 to 13.
Is the stock in an uptrend or downtrend?
Has it pulled back to an attractive level or is it overextended?
Is the market calm or chaotic?
Are price moves behaving normally or erratically?
Is overnight risk (gaps) under control?
Is there broader market panic happening?
Is the stock near its all-time high or trading lower?
Is there healthy trading volume?
When most of these factors line up positively, the background turns green and you see a GO arrow. When too many factors are negative, the background turns red and you see a WAIT arrow. In between, it stays yellow.
The three sensitivity modes
Conservative — Needs strong alignment across all factors before showing green. Fewer signals but higher quality. Best for long-term investors who want to avoid bad entries.
Balanced (default) — Middle ground. Shows green when conditions are clearly favorable without requiring perfection. Good for most people.
Aggressive — Shows green more often, catches more opportunities but also more false starts. Better for active traders comfortable with some risk.
What the colors mean in practice
Green background (FAVORABLE) — Trend is up, the stock has pulled back from highs, volatility is stable, no panic in the broader market. This is historically where buying has worked well. Not a guarantee, but the statistics are in your favor.
Yellow background (MIXED) — Some factors are positive, others are warning. You could buy a smaller position, or wait for green. This is the "maybe" zone where patience often pays off.
Red background (UNFAVORABLE) — Multiple risk factors are flashing. The stock might keep falling, volatility is unstable, or the broader market is stressed. Historically, buying in red conditions has led to worse outcomes on average. Waiting costs nothing.
The GO and WAIT arrows
These appear only at transition points — when the condition flips from one state to another. A GO arrow means conditions just turned favorable. A WAIT arrow means conditions just deteriorated. The arrows do not repeat every bar, only at the moment of change.
What this is NOT
This is not a crystal ball. It cannot predict earnings surprises, sudden news, or black swan events. It measures the statistical environment right now and tells you whether that environment has historically been favorable or unfavorable for buyers.
Think of it like checking the weather before going outside. A clear forecast does not guarantee sunshine all day, but it is better than walking out blind.
A word about what powers this
Under the surface, this indicator runs the same quantitative analysis used by institutional risk desks — realized volatility estimation, return distribution analysis, overnight gap decomposition, and cross-market regime detection. The difference is that all of that complexity is reduced to one color and one score. If you are curious about the individual components, each one is available as a separate indicator on this profile.
Settings
Sensitivity — Conservative, Balanced, or Aggressive. Start with Balanced.
Color chart background — Toggle the green/yellow/red background on or off.
Show buy/wait arrows — Toggle the transition arrows on or off.
That is it. Three settings. If you never touch them, the defaults work well.
That is the only question this indicator answers. Green means conditions are favorable. Red means they are not. Yellow means patience might pay off.
No complicated settings. No confusing numbers. The chart background changes color and arrows appear when conditions shift. If you want to know what is happening under the hood, the info box in the corner shows the score. If you do not care about the details, just follow the colors.
How it works (the simple version)
The indicator checks eight different things simultaneously and combines them into a single score from 0 to 13.
Is the stock in an uptrend or downtrend?
Has it pulled back to an attractive level or is it overextended?
Is the market calm or chaotic?
Are price moves behaving normally or erratically?
Is overnight risk (gaps) under control?
Is there broader market panic happening?
Is the stock near its all-time high or trading lower?
Is there healthy trading volume?
When most of these factors line up positively, the background turns green and you see a GO arrow. When too many factors are negative, the background turns red and you see a WAIT arrow. In between, it stays yellow.
The three sensitivity modes
Conservative — Needs strong alignment across all factors before showing green. Fewer signals but higher quality. Best for long-term investors who want to avoid bad entries.
Balanced (default) — Middle ground. Shows green when conditions are clearly favorable without requiring perfection. Good for most people.
Aggressive — Shows green more often, catches more opportunities but also more false starts. Better for active traders comfortable with some risk.
What the colors mean in practice
Green background (FAVORABLE) — Trend is up, the stock has pulled back from highs, volatility is stable, no panic in the broader market. This is historically where buying has worked well. Not a guarantee, but the statistics are in your favor.
Yellow background (MIXED) — Some factors are positive, others are warning. You could buy a smaller position, or wait for green. This is the "maybe" zone where patience often pays off.
Red background (UNFAVORABLE) — Multiple risk factors are flashing. The stock might keep falling, volatility is unstable, or the broader market is stressed. Historically, buying in red conditions has led to worse outcomes on average. Waiting costs nothing.
The GO and WAIT arrows
These appear only at transition points — when the condition flips from one state to another. A GO arrow means conditions just turned favorable. A WAIT arrow means conditions just deteriorated. The arrows do not repeat every bar, only at the moment of change.
What this is NOT
This is not a crystal ball. It cannot predict earnings surprises, sudden news, or black swan events. It measures the statistical environment right now and tells you whether that environment has historically been favorable or unfavorable for buyers.
Think of it like checking the weather before going outside. A clear forecast does not guarantee sunshine all day, but it is better than walking out blind.
A word about what powers this
Under the surface, this indicator runs the same quantitative analysis used by institutional risk desks — realized volatility estimation, return distribution analysis, overnight gap decomposition, and cross-market regime detection. The difference is that all of that complexity is reduced to one color and one score. If you are curious about the individual components, each one is available as a separate indicator on this profile.
Settings
Sensitivity — Conservative, Balanced, or Aggressive. Start with Balanced.
Color chart background — Toggle the green/yellow/red background on or off.
Show buy/wait arrows — Toggle the transition arrows on or off.
That is it. Three settings. If you never touch them, the defaults work well.
Skrip open-source
Dengan semangat TradingView yang sesungguhnya, pembuat skrip ini telah menjadikannya sebagai sumber terbuka, sehingga para trader dapat meninjau dan memverifikasi fungsinya. Salut untuk penulisnya! Meskipun Anda dapat menggunakannya secara gratis, perlu diingat bahwa penerbitan ulang kode ini tunduk pada Tata Tertib kami.

ThetaLoop | Algorithmic Options Research
🔍 Free CSP Score for any ticker — X-Ray Scanner:
thetaloop.app/xray
(Not financial advice)
🔍 Free CSP Score for any ticker — X-Ray Scanner:
thetaloop.app/xray
(Not financial advice)
Pernyataan Penyangkalan
Informasi dan publikasi ini tidak dimaksudkan, dan bukan merupakan, saran atau rekomendasi keuangan, investasi, trading, atau jenis lainnya yang diberikan atau didukung oleh TradingView. Baca selengkapnya di Ketentuan Penggunaan.
Skrip open-source
Dengan semangat TradingView yang sesungguhnya, pembuat skrip ini telah menjadikannya sebagai sumber terbuka, sehingga para trader dapat meninjau dan memverifikasi fungsinya. Salut untuk penulisnya! Meskipun Anda dapat menggunakannya secara gratis, perlu diingat bahwa penerbitan ulang kode ini tunduk pada Tata Tertib kami.
ThetaLoop | Algorithmic Options Research
🔍 Free CSP Score for any ticker — X-Ray Scanner:
thetaloop.app/xray
(Not financial advice)
🔍 Free CSP Score for any ticker — X-Ray Scanner:
thetaloop.app/xray
(Not financial advice)
Pernyataan Penyangkalan
Informasi dan publikasi ini tidak dimaksudkan, dan bukan merupakan, saran atau rekomendasi keuangan, investasi, trading, atau jenis lainnya yang diberikan atau didukung oleh TradingView. Baca selengkapnya di Ketentuan Penggunaan.