YATR | Previous Range From Daily Open
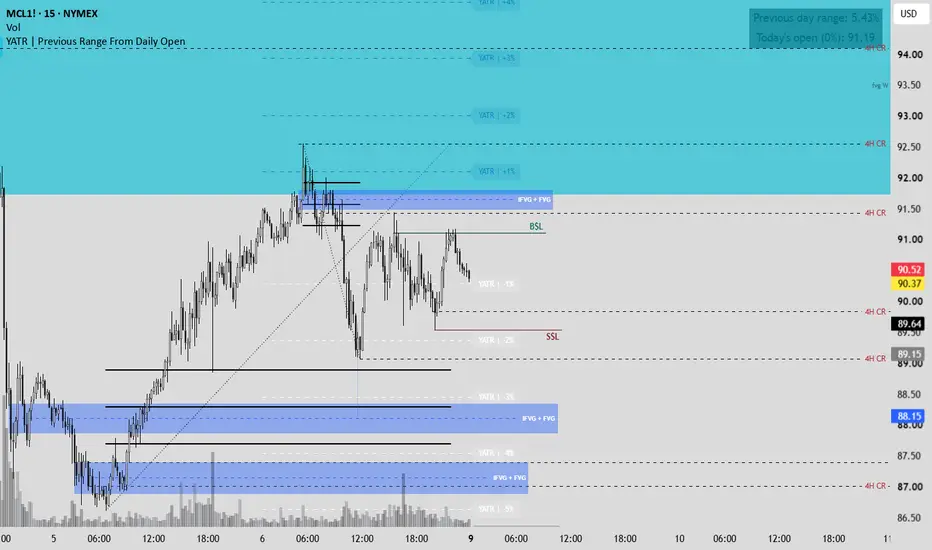
YATR — Previous Day’s Range Levels
This indicator uses the previous trading day’s high-to-low percentage range to draw levels above and below the current day’s opening price.
How it works
1. Calculates the previous day’s range:
Range (%) = (Previous High − Previous Low) ÷ Previous Low × 100
2. Uses the current trading day’s opening price as 0%.
3. Draws levels in 0.5% increments in both directions.
4. Adds the exact final percentage, labeled MAXIMUM ATR.
For example, if yesterday’s range was 3.4%, today’s levels appear at ±0.5%, ±1%, ±1.5%, ±2%, ±2.5%, ±3%, and ±3.4%, all measured from today’s open.
Colors
- Aqua: Today’s opening price.
- Green: Levels above the open.
- Red: Levels below the open.
- Orange: Final levels based on yesterday’s full percentage range.
Levels remain fixed throughout the session and update when a new trading day begins. Only the latest trading day’s levels are displayed. The percentage step and colors are adjustable.
Note: Despite the label “MAXIMUM ATR,” this indicator measures the previous day’s range, rather than an Average True Range. These levels are reference points, not a forecast or a limit on today’s price movement.
This indicator uses the previous trading day’s high-to-low percentage range to draw levels above and below the current day’s opening price.
How it works
1. Calculates the previous day’s range:
Range (%) = (Previous High − Previous Low) ÷ Previous Low × 100
2. Uses the current trading day’s opening price as 0%.
3. Draws levels in 0.5% increments in both directions.
4. Adds the exact final percentage, labeled MAXIMUM ATR.
For example, if yesterday’s range was 3.4%, today’s levels appear at ±0.5%, ±1%, ±1.5%, ±2%, ±2.5%, ±3%, and ±3.4%, all measured from today’s open.
Colors
- Aqua: Today’s opening price.
- Green: Levels above the open.
- Red: Levels below the open.
- Orange: Final levels based on yesterday’s full percentage range.
Levels remain fixed throughout the session and update when a new trading day begins. Only the latest trading day’s levels are displayed. The percentage step and colors are adjustable.
Note: Despite the label “MAXIMUM ATR,” this indicator measures the previous day’s range, rather than an Average True Range. These levels are reference points, not a forecast or a limit on today’s price movement.

Pernyataan Penyangkalan
Informasi dan publikasi ini tidak dimaksudkan, dan bukan merupakan, saran atau rekomendasi keuangan, investasi, trading, atau jenis lainnya yang diberikan atau didukung oleh TradingView. Baca selengkapnya di Ketentuan Penggunaan.
Pernyataan Penyangkalan
Informasi dan publikasi ini tidak dimaksudkan, dan bukan merupakan, saran atau rekomendasi keuangan, investasi, trading, atau jenis lainnya yang diberikan atau didukung oleh TradingView. Baca selengkapnya di Ketentuan Penggunaan.