[DAOL] P/E Band V2
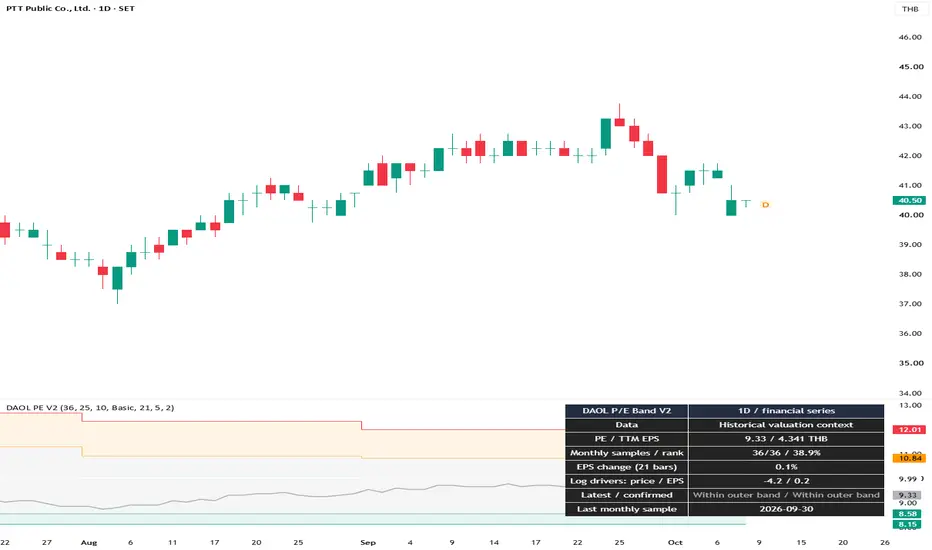
⏺️ What is it?
[DAOL] P/E Band V2 compares a stock’s current trailing Price-to-Earnings ratio with its own historical monthly observations.
It also separates changes in P/E into price and earnings-per-share contributions, helping users understand why the ratio changed.
🔹 P/E — closing price divided by positive trailing-twelve-month EPS
🔹 Historical Bands — percentile levels calculated from completed monthly P/E samples
🔹 Historical Rank — current P/E’s relative position within those samples
🔹 Price / EPS Drivers — the mathematical contributions of price and EPS changes
This indicator provides historical valuation context. It does not calculate intrinsic value or issue automatic buy/sell recommendations.
⏺️ Indicator นี้คืออะไร?
[DAOL] P/E Band V2 คือเครื่องมือเปรียบเทียบ P/E ปัจจุบันกับประวัติของหุ้นตัวเดียวกัน พร้อมแยกว่าการเปลี่ยนของ P/E มาจากราคาหรือกำไรต่อหุ้น
🔹 P/E — ราคาปิดหารด้วย EPS ย้อนหลัง 12 เดือนที่เป็นบวก
🔹 Historical Bands — กรอบเปอร์เซ็นไทล์จากตัวอย่าง P/E สิ้นเดือน
🔹 Historical Rank — ตำแหน่ง P/E ปัจจุบันเมื่อเทียบกับตัวอย่างย้อนหลัง
🔹 Price / EPS Drivers — ส่วนของการเปลี่ยน P/E ที่มาจากราคาและ EPS ตามสูตร
เป็นเครื่องมือประกอบการอ่านมูลค่าเทียบประวัติ ไม่ได้คำนวณมูลค่าที่แท้จริงหรือแนะนำซื้อขายโดยอัตโนมัติ
⏺️ Why use P/E Band V2?
🔹 Compares current P/E with the stock’s own history
🔹 Samples once per completed month to avoid weighting every daily observation equally
🔹 Uses empirical percentile bands rather than assuming a normal distribution
🔹 Adds EPS context when P/E falls below its historical range
🔹 Explains how both numerator and denominator affect P/E
A lower P/E can result from a falling price or rising EPS. A higher P/E can result from a rising price or falling EPS.
⏺️ ทำไมต้องใช้?
🔹 เทียบ P/E ปัจจุบันกับประวัติของหุ้นตัวเอง
🔹 เก็บเดือนละหนึ่งตัวอย่าง แทนการนำทุกแท่งวันมาถ่วงน้ำหนักเท่ากัน
🔹 ใช้เปอร์เซ็นไทล์จากข้อมูลจริงในชุดตัวอย่าง ไม่สมมติว่าข้อมูลแจกแจงปกติ
🔹 เพิ่มบริบท EPS เมื่อ P/E ต่ำกว่ากรอบประวัติ
🔹 อธิบายผลของทั้งราคาและกำไรต่อหุ้นต่อค่า P/E
P/E ลดลงอาจเกิดจากราคาลดหรือ EPS เพิ่ม ส่วน P/E สูงขึ้นอาจเกิดจากราคาเพิ่มหรือ EPS ลด จึงไม่ควรอ่านอัตราส่วนเพียงตัวเดียว
⏺️ Who should use it?
🔹 Equity investors comparing a stock’s valuation with its own history
🔹 Analysts combining valuation with earnings context
🔹 Users seeking a clearer explanation of changes in P/E
Use a standard 1-day stock chart with available TTM EPS data.
This version does not support valuation of futures, options, forex, crypto, or indices without suitable company EPS data.
⏺️ เหมาะกับใคร?
🔹 นักลงทุนหุ้นที่ต้องการเทียบระดับมูลค่ากับประวัติของหุ้นตัวเอง
🔹 นักวิเคราะห์ที่อ่านมูลค่าร่วมกับบริบทกำไร
🔹 ผู้ใช้ที่ต้องการเข้าใจสาเหตุการเปลี่ยนของ P/E
ใช้กับ กราฟหุ้นรายตัว Timeframe 1D ที่มีข้อมูล EPS TTM
เวอร์ชันนี้ไม่ได้รองรับการประเมินมูลค่า Futures, Options, Forex, Crypto หรือดัชนีที่ไม่มีข้อมูล EPS บริษัทให้ใช้คำนวณ เช่น S50 Futures จะแสดง “No TTM EPS”
⏺️ How does it work?
Request Basic or Diluted TTM EPS from TradingView’s financial data.
Calculate P/E only when price and EPS are positive.
At the first closed daily bar of each new month, store the preceding bar’s P/E as the completed-month sample.
Retain the latest 36 monthly samples by default.
Calculate the 10th, 25th, 50th, 75th and 90th percentiles.
Compare current P/E with those historical reference levels.
The bands update monthly and remain fixed between updates. They require the full selected sample count.
⏺️ ทำงานอย่างไร?
ดึง EPS TTM แบบ Basic หรือ Diluted จากข้อมูล Financial ของ TradingView
คำนวณ P/E เมื่อราคาและ EPS เป็นบวกเท่านั้น
เมื่อแท่งวันแรกของเดือนใหม่ปิด เก็บ P/E ของแท่งก่อนหน้าเป็นตัวอย่างสิ้นเดือน
เก็บ 36 ตัวอย่างรายเดือนล่าสุดตามค่าเริ่มต้น
คำนวณเปอร์เซ็นไทล์ 10, 25, 50, 75 และ 90
เปรียบเทียบ P/E ปัจจุบันกับระดับอ้างอิงเหล่านั้น
กรอบอัปเดตรายเดือนและคงที่ระหว่างรอบ ต้องมีตัวอย่างครบจำนวนที่เลือกก่อนเริ่มแสดงกรอบ
หากตัวอย่างสิ้นเดือนไม่มี P/E ที่เป็นบวก ระบบจะล้างชุดตัวอย่างและเริ่มสะสมใหม่ เพื่อไม่เลือกเก็บเฉพาะเดือนที่มีกำไร
⏺️ How to read the bands
🔹 Median — the 50th percentile of monthly P/E observations
🔹 Inner Band — the 25th–75th percentile range by default
🔹 Outer Band — the 10th–90th percentile range by default
Below the lower outer band means P/E is low relative to the selected historical samples. Above the upper outer band means it is high relative to those samples.
These bands are not fair-value estimates, confidence intervals, or future price targets.
⏺️ อ่านกรอบอย่างไร?
🔹 Median — ค่ากึ่งกลางหรือเปอร์เซ็นไทล์ที่ 50
🔹 Inner Band — กรอบเปอร์เซ็นไทล์ 25–75 ตามค่าเริ่มต้น
🔹 Outer Band — กรอบเปอร์เซ็นไทล์ 10–90 ตามค่าเริ่มต้น
ต่ำกว่าขอบล่างหมายถึง P/E ต่ำเมื่อเทียบกับชุดประวัติที่เลือก สูงกว่าขอบบนหมายถึง P/E สูงเมื่อเทียบกับชุดประวัตินั้น
ไม่ได้ยืนยันว่าหุ้นถูกหรือแพงตามมูลค่าที่แท้จริง และไม่ใช่กรอบราคาเป้าหมาย
⏺️ How to read the colors
🔹 Aqua — below the lower outer band, with EPS decline not exceeding the selected threshold
🔹 Orange — below the lower outer band, with EPS weakening beyond the threshold
🔹 Red — above the upper outer band
🔹 Silver — within the outer band
🔹 Gray — historical reference or EPS-driver context unavailable
The default EPS comparison is 21 trading bars, with weakening defined as a decline greater than 5%.
“EPS not weakening” does not confirm earnings quality, sustainable growth, or investment suitability.
⏺️ อ่านสีอย่างไร?
🔹 ฟ้า — P/E ต่ำกว่าขอบล่าง โดย EPS ไม่ลดเกินเกณฑ์
🔹 ส้ม — P/E ต่ำกว่าขอบล่าง พร้อม EPS ลดเกินเกณฑ์
🔹 แดง — P/E สูงกว่าขอบบน
🔹 เงิน — P/E อยู่ภายในกรอบด้านนอก
🔹 เทา — ข้อมูลกรอบประวัติหรือบริบท EPS ยังไม่พร้อม
ค่าเริ่มต้นเทียบ EPS กับ 21 แท่งซื้อขายก่อนหน้า และถือว่าอ่อนลงเมื่อ EPS ลดมากกว่า 5%
“EPS ไม่อ่อนลง” ไม่ได้ยืนยันคุณภาพกำไร การเติบโตอย่างยั่งยืน หรือความเหมาะสมในการลงทุน
⏺️ Price versus earnings
For positive inputs:
Log P/E Change = Log Price Change − Log EPS Change
The indicator displays the two contributions multiplied by 100. They add up to the total log change in P/E.
Examples:
🔹 Price falls 20%, EPS unchanged → P/E falls 20%
🔹 EPS rises 25%, price unchanged → P/E falls 20%
🔹 EPS falls 20%, price unchanged → P/E rises 25%
Driver values are additive log-change units, not ordinary percentage returns.
⏺️ แยกผลจากราคาและกำไรอย่างไร?
เมื่อราคาและ EPS เป็นบวก:
Log Change ของ P/E = Log Change ของราคา − Log Change ของ EPS
ระบบแสดงส่วนจากราคาและ EPS โดยคูณ 100 ซึ่งบวกกันได้ตรงกับ Log Change รวมของ P/E
ตัวอย่าง:
🔹 ราคาลด 20% แต่ EPS เท่าเดิม → P/E ลด 20%
🔹 EPS เพิ่ม 25% แต่ราคาเท่าเดิม → P/E ลด 20%
🔹 EPS ลด 20% แต่ราคาเท่าเดิม → P/E เพิ่ม 25%
ตัวเลข Drivers เป็นหน่วย Log Change ที่รวมกันได้ ไม่ใช่เปอร์เซ็นต์ผลตอบแทนทั่วไป
⏺️ Historical Rank and optional comparison
Historical Rank measures how many reference samples are below current P/E, with half weight given to exact ties.
A rank of 10% means current P/E is near the lower end of the selected sample distribution. It does not mean a 90% chance of upside.
The optional purple line shows current price divided by EPS from the comparison date. It illustrates P/E with old EPS held fixed—not a fair-value forecast.
⏺️ Historical Rank และเส้นเปรียบเทียบ
Historical Rank วัดตำแหน่ง P/E ปัจจุบันเทียบกับชุดตัวอย่าง โดยค่าที่เท่ากันให้น้ำหนักครึ่งหนึ่ง
Rank 10% หมายถึง P/E อยู่ใกล้ส่วนล่างของชุดประวัติ ไม่ได้หมายถึงมีโอกาสขึ้น 90%
เส้นม่วงที่เปิดเพิ่มได้แสดงราคาปัจจุบันหารด้วย EPS จากวันที่ใช้เปรียบเทียบ เพื่อดูภาพเมื่อคง EPS เดิมไว้ ไม่ใช่การคาดการณ์มูลค่ายุติธรรม
⏺️ Default settings
🔹 Chart — 1D
🔹 Monthly Samples — 36
🔹 EPS Type — Basic TTM
🔹 Inner Percentiles — 25 / 75
🔹 Outer Percentiles — 10 / 90
🔹 Driver Comparison — 21 trading bars
🔹 EPS Weakening Threshold — more than 5% decline
🔹 State Confirmation — 2 consecutive closed bars
If the dashboard shows “Building monthly reference,” more valid monthly samples are needed. Load additional history or select a shorter reference length.
If it shows “No TTM EPS,” the selected symbol or financial field has no usable EPS data.
⏺️ ค่าเริ่มต้น
🔹 กราฟ — 1D
🔹 Monthly Samples — 36 ตัวอย่าง
🔹 EPS Type — Basic TTM
🔹 Inner Percentiles — 25 / 75
🔹 Outer Percentiles — 10 / 90
🔹 Driver Comparison — 21 แท่งซื้อขาย
🔹 EPS Weakening Threshold — ลดมากกว่า 5%
🔹 State Confirmation — 2 แท่งปิดต่อเนื่อง
หากขึ้น “Building monthly reference” ต้องสะสมตัวอย่างเพิ่ม ให้โหลดประวัติเพิ่มหรือเลือกช่วงอ้างอิงสั้นลง
หากขึ้น “No TTM EPS” หมายถึง Symbol หรือช่องข้อมูล Financial ที่เลือกไม่มี EPS ที่ใช้งานได้
⏺️ Alerts
🔹 Low PE without EPS weakening
🔹 Low PE with EPS weakening
🔹 High historical PE
🔹 Back within outer band
🔹 Any confirmed valuation-state change
Alerts require consecutive closed-bar confirmation and occur when the confirmed state changes.
The first state and the first state after a monthly reference update initialize silently. A change in EPS context can create a state transition even when P/E remains below the lower band.
Create alerts with “Once Per Bar Close” and recreate them after changing inputs or code.
⏺️ การแจ้งเตือน
🔹 Low PE without EPS weakening — P/E ต่ำ โดย EPS ไม่อ่อนลงเกินเกณฑ์
🔹 Low PE with EPS weakening — P/E ต่ำ พร้อม EPS อ่อนลง
🔹 High historical PE — P/E สูงเทียบประวัติ
🔹 Back within outer band — กลับเข้ากรอบ
🔹 Any confirmed valuation-state change — สถานะยืนยันเปลี่ยนทุกประเภท
Alert รอแท่งปิดต่อเนื่องและแจ้งเมื่อสถานะยืนยันเปลี่ยน
สถานะแรกและสถานะแรกหลังอัปเดตกรอบรายเดือนใช้เริ่มต้นระบบโดยไม่แจ้งเตือน การเปลี่ยนบริบท EPS สามารถเปลี่ยนสถานะได้ แม้ P/E ยังอยู่ใต้กรอบเดิม
ตั้ง “Once Per Bar Close” และสร้าง Alert ใหม่หลังเปลี่ยน Input หรือโค้ด
⏺️ Development and references
This Pine Script v6 implementation extends the user-supplied [DAOL] P/E Band V1 concept. No Community script code was copied for this development.
V2 adds explicit monthly sampling, empirical percentile bands, historical rank, price/EPS decomposition, earnings-context states and closed-bar alerts.
P/E, percentiles, median, empirical rank and logarithmic identities are standard concepts. No claim is made that these underlying concepts are new.
References:
TradingView — Other timeframes and data
tradingview.com/pine-script-docs/concepts/other-timeframes-and-data/
TradingView — What financial data is available in Pine?
tradingview.com/support/solutions/43000564727-what-financial-data-is-available-in-pine/
⏺️ การพัฒนาและอ้างอิง
เขียนด้วย Pine Script v6 โดยต่อยอดแนวคิด [DAOL] P/E Band V1 ที่ผู้ใช้ส่งมา ไม่คัดลอกโค้ดจากสคริปต์ Community สำหรับการพัฒนาครั้งนี้
เพิ่มการเก็บตัวอย่างรายเดือน กรอบเปอร์เซ็นไทล์ อันดับเทียบประวัติ การแยกผลจากราคา/EPS สถานะบริบทกำไร และ Alert จากแท่งปิด
P/E และสูตรสถิติพื้นฐานเป็นแนวคิดมาตรฐาน ไม่ได้อ้างว่าเป็นสิ่งประดิษฐ์ใหม่ทั้งหมด หากโค้ดฐานมีส่วนจากผู้เขียนอื่น ต้องคงเครดิตและประกาศของผู้เขียนเดิมก่อนเผยแพร่
⏺️ Limitations and disclaimer
🔹 Financial series can be aligned to fiscal periods and revised retrospectively. Historical values are not guaranteed to represent information available on each earnings-announcement date.
🔹 Closed-bar confirmation does not prevent fundamental-data revisions.
🔹 Nonpositive EPS makes conventional P/E unsuitable; the indicator suppresses it.
🔹 Small positive EPS, one-off earnings, cyclicality, splits and currency/share-basis differences can distort comparisons.
🔹 Low historical P/E does not guarantee undervaluation; high historical P/E does not guarantee overvaluation.
🔹 Numerical checks have been completed. Comprehensive stock-data validation remains pending.
🔹 For educational and informational purposes only. It does not constitute investment advice or guarantee returns.
⏺️ ข้อจำกัดและคำชี้แจง
🔹 ข้อมูล Financial อาจจัดเวลาตามงวดบัญชีและแก้ไขย้อนหลัง ไม่รับประกันว่าเป็นข้อมูลที่นักลงทุนรู้แล้ว ณ วันประกาศงบ
🔹 การรอแท่งปิดไม่ได้ป้องกันการแก้ไขข้อมูลพื้นฐานย้อนหลัง
🔹 EPS ไม่เป็นบวกทำให้ P/E แบบทั่วไปตีความไม่เหมาะสม ระบบจึงไม่แสดง
🔹 EPS บวกที่ต่ำมาก กำไรพิเศษ วัฏจักรธุรกิจ การแตกหุ้น และความต่างด้านสกุลเงิน/ฐานหุ้น อาจทำให้เปรียบเทียบคลาดเคลื่อน
🔹 P/E ต่ำเทียบประวัติไม่ได้รับประกันว่าหุ้นถูก และ P/E สูงไม่ได้รับประกันว่าหุ้นแพง
🔹 ตรวจสูตรเชิงตัวเลขแล้ว แต่ยังต้องตรวจสอบกับข้อมูลหุ้นจริงอย่างครอบคลุม
🔹 ใช้เพื่อการศึกษาและประกอบการวิเคราะห์ ไม่ถือเป็นคำแนะนำการลงทุนหรือการรับประกันผลตอบแทน
[DAOL] P/E Band V2 compares a stock’s current trailing Price-to-Earnings ratio with its own historical monthly observations.
It also separates changes in P/E into price and earnings-per-share contributions, helping users understand why the ratio changed.
🔹 P/E — closing price divided by positive trailing-twelve-month EPS
🔹 Historical Bands — percentile levels calculated from completed monthly P/E samples
🔹 Historical Rank — current P/E’s relative position within those samples
🔹 Price / EPS Drivers — the mathematical contributions of price and EPS changes
This indicator provides historical valuation context. It does not calculate intrinsic value or issue automatic buy/sell recommendations.
⏺️ Indicator นี้คืออะไร?
[DAOL] P/E Band V2 คือเครื่องมือเปรียบเทียบ P/E ปัจจุบันกับประวัติของหุ้นตัวเดียวกัน พร้อมแยกว่าการเปลี่ยนของ P/E มาจากราคาหรือกำไรต่อหุ้น
🔹 P/E — ราคาปิดหารด้วย EPS ย้อนหลัง 12 เดือนที่เป็นบวก
🔹 Historical Bands — กรอบเปอร์เซ็นไทล์จากตัวอย่าง P/E สิ้นเดือน
🔹 Historical Rank — ตำแหน่ง P/E ปัจจุบันเมื่อเทียบกับตัวอย่างย้อนหลัง
🔹 Price / EPS Drivers — ส่วนของการเปลี่ยน P/E ที่มาจากราคาและ EPS ตามสูตร
เป็นเครื่องมือประกอบการอ่านมูลค่าเทียบประวัติ ไม่ได้คำนวณมูลค่าที่แท้จริงหรือแนะนำซื้อขายโดยอัตโนมัติ
⏺️ Why use P/E Band V2?
🔹 Compares current P/E with the stock’s own history
🔹 Samples once per completed month to avoid weighting every daily observation equally
🔹 Uses empirical percentile bands rather than assuming a normal distribution
🔹 Adds EPS context when P/E falls below its historical range
🔹 Explains how both numerator and denominator affect P/E
A lower P/E can result from a falling price or rising EPS. A higher P/E can result from a rising price or falling EPS.
⏺️ ทำไมต้องใช้?
🔹 เทียบ P/E ปัจจุบันกับประวัติของหุ้นตัวเอง
🔹 เก็บเดือนละหนึ่งตัวอย่าง แทนการนำทุกแท่งวันมาถ่วงน้ำหนักเท่ากัน
🔹 ใช้เปอร์เซ็นไทล์จากข้อมูลจริงในชุดตัวอย่าง ไม่สมมติว่าข้อมูลแจกแจงปกติ
🔹 เพิ่มบริบท EPS เมื่อ P/E ต่ำกว่ากรอบประวัติ
🔹 อธิบายผลของทั้งราคาและกำไรต่อหุ้นต่อค่า P/E
P/E ลดลงอาจเกิดจากราคาลดหรือ EPS เพิ่ม ส่วน P/E สูงขึ้นอาจเกิดจากราคาเพิ่มหรือ EPS ลด จึงไม่ควรอ่านอัตราส่วนเพียงตัวเดียว
⏺️ Who should use it?
🔹 Equity investors comparing a stock’s valuation with its own history
🔹 Analysts combining valuation with earnings context
🔹 Users seeking a clearer explanation of changes in P/E
Use a standard 1-day stock chart with available TTM EPS data.
This version does not support valuation of futures, options, forex, crypto, or indices without suitable company EPS data.
⏺️ เหมาะกับใคร?
🔹 นักลงทุนหุ้นที่ต้องการเทียบระดับมูลค่ากับประวัติของหุ้นตัวเอง
🔹 นักวิเคราะห์ที่อ่านมูลค่าร่วมกับบริบทกำไร
🔹 ผู้ใช้ที่ต้องการเข้าใจสาเหตุการเปลี่ยนของ P/E
ใช้กับ กราฟหุ้นรายตัว Timeframe 1D ที่มีข้อมูล EPS TTM
เวอร์ชันนี้ไม่ได้รองรับการประเมินมูลค่า Futures, Options, Forex, Crypto หรือดัชนีที่ไม่มีข้อมูล EPS บริษัทให้ใช้คำนวณ เช่น S50 Futures จะแสดง “No TTM EPS”
⏺️ How does it work?
Request Basic or Diluted TTM EPS from TradingView’s financial data.
Calculate P/E only when price and EPS are positive.
At the first closed daily bar of each new month, store the preceding bar’s P/E as the completed-month sample.
Retain the latest 36 monthly samples by default.
Calculate the 10th, 25th, 50th, 75th and 90th percentiles.
Compare current P/E with those historical reference levels.
The bands update monthly and remain fixed between updates. They require the full selected sample count.
⏺️ ทำงานอย่างไร?
ดึง EPS TTM แบบ Basic หรือ Diluted จากข้อมูล Financial ของ TradingView
คำนวณ P/E เมื่อราคาและ EPS เป็นบวกเท่านั้น
เมื่อแท่งวันแรกของเดือนใหม่ปิด เก็บ P/E ของแท่งก่อนหน้าเป็นตัวอย่างสิ้นเดือน
เก็บ 36 ตัวอย่างรายเดือนล่าสุดตามค่าเริ่มต้น
คำนวณเปอร์เซ็นไทล์ 10, 25, 50, 75 และ 90
เปรียบเทียบ P/E ปัจจุบันกับระดับอ้างอิงเหล่านั้น
กรอบอัปเดตรายเดือนและคงที่ระหว่างรอบ ต้องมีตัวอย่างครบจำนวนที่เลือกก่อนเริ่มแสดงกรอบ
หากตัวอย่างสิ้นเดือนไม่มี P/E ที่เป็นบวก ระบบจะล้างชุดตัวอย่างและเริ่มสะสมใหม่ เพื่อไม่เลือกเก็บเฉพาะเดือนที่มีกำไร
⏺️ How to read the bands
🔹 Median — the 50th percentile of monthly P/E observations
🔹 Inner Band — the 25th–75th percentile range by default
🔹 Outer Band — the 10th–90th percentile range by default
Below the lower outer band means P/E is low relative to the selected historical samples. Above the upper outer band means it is high relative to those samples.
These bands are not fair-value estimates, confidence intervals, or future price targets.
⏺️ อ่านกรอบอย่างไร?
🔹 Median — ค่ากึ่งกลางหรือเปอร์เซ็นไทล์ที่ 50
🔹 Inner Band — กรอบเปอร์เซ็นไทล์ 25–75 ตามค่าเริ่มต้น
🔹 Outer Band — กรอบเปอร์เซ็นไทล์ 10–90 ตามค่าเริ่มต้น
ต่ำกว่าขอบล่างหมายถึง P/E ต่ำเมื่อเทียบกับชุดประวัติที่เลือก สูงกว่าขอบบนหมายถึง P/E สูงเมื่อเทียบกับชุดประวัตินั้น
ไม่ได้ยืนยันว่าหุ้นถูกหรือแพงตามมูลค่าที่แท้จริง และไม่ใช่กรอบราคาเป้าหมาย
⏺️ How to read the colors
🔹 Aqua — below the lower outer band, with EPS decline not exceeding the selected threshold
🔹 Orange — below the lower outer band, with EPS weakening beyond the threshold
🔹 Red — above the upper outer band
🔹 Silver — within the outer band
🔹 Gray — historical reference or EPS-driver context unavailable
The default EPS comparison is 21 trading bars, with weakening defined as a decline greater than 5%.
“EPS not weakening” does not confirm earnings quality, sustainable growth, or investment suitability.
⏺️ อ่านสีอย่างไร?
🔹 ฟ้า — P/E ต่ำกว่าขอบล่าง โดย EPS ไม่ลดเกินเกณฑ์
🔹 ส้ม — P/E ต่ำกว่าขอบล่าง พร้อม EPS ลดเกินเกณฑ์
🔹 แดง — P/E สูงกว่าขอบบน
🔹 เงิน — P/E อยู่ภายในกรอบด้านนอก
🔹 เทา — ข้อมูลกรอบประวัติหรือบริบท EPS ยังไม่พร้อม
ค่าเริ่มต้นเทียบ EPS กับ 21 แท่งซื้อขายก่อนหน้า และถือว่าอ่อนลงเมื่อ EPS ลดมากกว่า 5%
“EPS ไม่อ่อนลง” ไม่ได้ยืนยันคุณภาพกำไร การเติบโตอย่างยั่งยืน หรือความเหมาะสมในการลงทุน
⏺️ Price versus earnings
For positive inputs:
Log P/E Change = Log Price Change − Log EPS Change
The indicator displays the two contributions multiplied by 100. They add up to the total log change in P/E.
Examples:
🔹 Price falls 20%, EPS unchanged → P/E falls 20%
🔹 EPS rises 25%, price unchanged → P/E falls 20%
🔹 EPS falls 20%, price unchanged → P/E rises 25%
Driver values are additive log-change units, not ordinary percentage returns.
⏺️ แยกผลจากราคาและกำไรอย่างไร?
เมื่อราคาและ EPS เป็นบวก:
Log Change ของ P/E = Log Change ของราคา − Log Change ของ EPS
ระบบแสดงส่วนจากราคาและ EPS โดยคูณ 100 ซึ่งบวกกันได้ตรงกับ Log Change รวมของ P/E
ตัวอย่าง:
🔹 ราคาลด 20% แต่ EPS เท่าเดิม → P/E ลด 20%
🔹 EPS เพิ่ม 25% แต่ราคาเท่าเดิม → P/E ลด 20%
🔹 EPS ลด 20% แต่ราคาเท่าเดิม → P/E เพิ่ม 25%
ตัวเลข Drivers เป็นหน่วย Log Change ที่รวมกันได้ ไม่ใช่เปอร์เซ็นต์ผลตอบแทนทั่วไป
⏺️ Historical Rank and optional comparison
Historical Rank measures how many reference samples are below current P/E, with half weight given to exact ties.
A rank of 10% means current P/E is near the lower end of the selected sample distribution. It does not mean a 90% chance of upside.
The optional purple line shows current price divided by EPS from the comparison date. It illustrates P/E with old EPS held fixed—not a fair-value forecast.
⏺️ Historical Rank และเส้นเปรียบเทียบ
Historical Rank วัดตำแหน่ง P/E ปัจจุบันเทียบกับชุดตัวอย่าง โดยค่าที่เท่ากันให้น้ำหนักครึ่งหนึ่ง
Rank 10% หมายถึง P/E อยู่ใกล้ส่วนล่างของชุดประวัติ ไม่ได้หมายถึงมีโอกาสขึ้น 90%
เส้นม่วงที่เปิดเพิ่มได้แสดงราคาปัจจุบันหารด้วย EPS จากวันที่ใช้เปรียบเทียบ เพื่อดูภาพเมื่อคง EPS เดิมไว้ ไม่ใช่การคาดการณ์มูลค่ายุติธรรม
⏺️ Default settings
🔹 Chart — 1D
🔹 Monthly Samples — 36
🔹 EPS Type — Basic TTM
🔹 Inner Percentiles — 25 / 75
🔹 Outer Percentiles — 10 / 90
🔹 Driver Comparison — 21 trading bars
🔹 EPS Weakening Threshold — more than 5% decline
🔹 State Confirmation — 2 consecutive closed bars
If the dashboard shows “Building monthly reference,” more valid monthly samples are needed. Load additional history or select a shorter reference length.
If it shows “No TTM EPS,” the selected symbol or financial field has no usable EPS data.
⏺️ ค่าเริ่มต้น
🔹 กราฟ — 1D
🔹 Monthly Samples — 36 ตัวอย่าง
🔹 EPS Type — Basic TTM
🔹 Inner Percentiles — 25 / 75
🔹 Outer Percentiles — 10 / 90
🔹 Driver Comparison — 21 แท่งซื้อขาย
🔹 EPS Weakening Threshold — ลดมากกว่า 5%
🔹 State Confirmation — 2 แท่งปิดต่อเนื่อง
หากขึ้น “Building monthly reference” ต้องสะสมตัวอย่างเพิ่ม ให้โหลดประวัติเพิ่มหรือเลือกช่วงอ้างอิงสั้นลง
หากขึ้น “No TTM EPS” หมายถึง Symbol หรือช่องข้อมูล Financial ที่เลือกไม่มี EPS ที่ใช้งานได้
⏺️ Alerts
🔹 Low PE without EPS weakening
🔹 Low PE with EPS weakening
🔹 High historical PE
🔹 Back within outer band
🔹 Any confirmed valuation-state change
Alerts require consecutive closed-bar confirmation and occur when the confirmed state changes.
The first state and the first state after a monthly reference update initialize silently. A change in EPS context can create a state transition even when P/E remains below the lower band.
Create alerts with “Once Per Bar Close” and recreate them after changing inputs or code.
⏺️ การแจ้งเตือน
🔹 Low PE without EPS weakening — P/E ต่ำ โดย EPS ไม่อ่อนลงเกินเกณฑ์
🔹 Low PE with EPS weakening — P/E ต่ำ พร้อม EPS อ่อนลง
🔹 High historical PE — P/E สูงเทียบประวัติ
🔹 Back within outer band — กลับเข้ากรอบ
🔹 Any confirmed valuation-state change — สถานะยืนยันเปลี่ยนทุกประเภท
Alert รอแท่งปิดต่อเนื่องและแจ้งเมื่อสถานะยืนยันเปลี่ยน
สถานะแรกและสถานะแรกหลังอัปเดตกรอบรายเดือนใช้เริ่มต้นระบบโดยไม่แจ้งเตือน การเปลี่ยนบริบท EPS สามารถเปลี่ยนสถานะได้ แม้ P/E ยังอยู่ใต้กรอบเดิม
ตั้ง “Once Per Bar Close” และสร้าง Alert ใหม่หลังเปลี่ยน Input หรือโค้ด
⏺️ Development and references
This Pine Script v6 implementation extends the user-supplied [DAOL] P/E Band V1 concept. No Community script code was copied for this development.
V2 adds explicit monthly sampling, empirical percentile bands, historical rank, price/EPS decomposition, earnings-context states and closed-bar alerts.
P/E, percentiles, median, empirical rank and logarithmic identities are standard concepts. No claim is made that these underlying concepts are new.
References:
TradingView — Other timeframes and data
tradingview.com/pine-script-docs/concepts/other-timeframes-and-data/
TradingView — What financial data is available in Pine?
tradingview.com/support/solutions/43000564727-what-financial-data-is-available-in-pine/
⏺️ การพัฒนาและอ้างอิง
เขียนด้วย Pine Script v6 โดยต่อยอดแนวคิด [DAOL] P/E Band V1 ที่ผู้ใช้ส่งมา ไม่คัดลอกโค้ดจากสคริปต์ Community สำหรับการพัฒนาครั้งนี้
เพิ่มการเก็บตัวอย่างรายเดือน กรอบเปอร์เซ็นไทล์ อันดับเทียบประวัติ การแยกผลจากราคา/EPS สถานะบริบทกำไร และ Alert จากแท่งปิด
P/E และสูตรสถิติพื้นฐานเป็นแนวคิดมาตรฐาน ไม่ได้อ้างว่าเป็นสิ่งประดิษฐ์ใหม่ทั้งหมด หากโค้ดฐานมีส่วนจากผู้เขียนอื่น ต้องคงเครดิตและประกาศของผู้เขียนเดิมก่อนเผยแพร่
⏺️ Limitations and disclaimer
🔹 Financial series can be aligned to fiscal periods and revised retrospectively. Historical values are not guaranteed to represent information available on each earnings-announcement date.
🔹 Closed-bar confirmation does not prevent fundamental-data revisions.
🔹 Nonpositive EPS makes conventional P/E unsuitable; the indicator suppresses it.
🔹 Small positive EPS, one-off earnings, cyclicality, splits and currency/share-basis differences can distort comparisons.
🔹 Low historical P/E does not guarantee undervaluation; high historical P/E does not guarantee overvaluation.
🔹 Numerical checks have been completed. Comprehensive stock-data validation remains pending.
🔹 For educational and informational purposes only. It does not constitute investment advice or guarantee returns.
⏺️ ข้อจำกัดและคำชี้แจง
🔹 ข้อมูล Financial อาจจัดเวลาตามงวดบัญชีและแก้ไขย้อนหลัง ไม่รับประกันว่าเป็นข้อมูลที่นักลงทุนรู้แล้ว ณ วันประกาศงบ
🔹 การรอแท่งปิดไม่ได้ป้องกันการแก้ไขข้อมูลพื้นฐานย้อนหลัง
🔹 EPS ไม่เป็นบวกทำให้ P/E แบบทั่วไปตีความไม่เหมาะสม ระบบจึงไม่แสดง
🔹 EPS บวกที่ต่ำมาก กำไรพิเศษ วัฏจักรธุรกิจ การแตกหุ้น และความต่างด้านสกุลเงิน/ฐานหุ้น อาจทำให้เปรียบเทียบคลาดเคลื่อน
🔹 P/E ต่ำเทียบประวัติไม่ได้รับประกันว่าหุ้นถูก และ P/E สูงไม่ได้รับประกันว่าหุ้นแพง
🔹 ตรวจสูตรเชิงตัวเลขแล้ว แต่ยังต้องตรวจสอบกับข้อมูลหุ้นจริงอย่างครอบคลุม
🔹 ใช้เพื่อการศึกษาและประกอบการวิเคราะห์ ไม่ถือเป็นคำแนะนำการลงทุนหรือการรับประกันผลตอบแทน

Pernyataan Penyangkalan
Informasi dan publikasi ini tidak dimaksudkan, dan bukan merupakan, saran atau rekomendasi keuangan, investasi, trading, atau jenis lainnya yang diberikan atau didukung oleh TradingView. Baca selengkapnya di Ketentuan Penggunaan.
Pernyataan Penyangkalan
Informasi dan publikasi ini tidak dimaksudkan, dan bukan merupakan, saran atau rekomendasi keuangan, investasi, trading, atau jenis lainnya yang diberikan atau didukung oleh TradingView. Baca selengkapnya di Ketentuan Penggunaan.