OPEN-SOURCE SCRIPT
Diupdate Key Price Levels + Zones
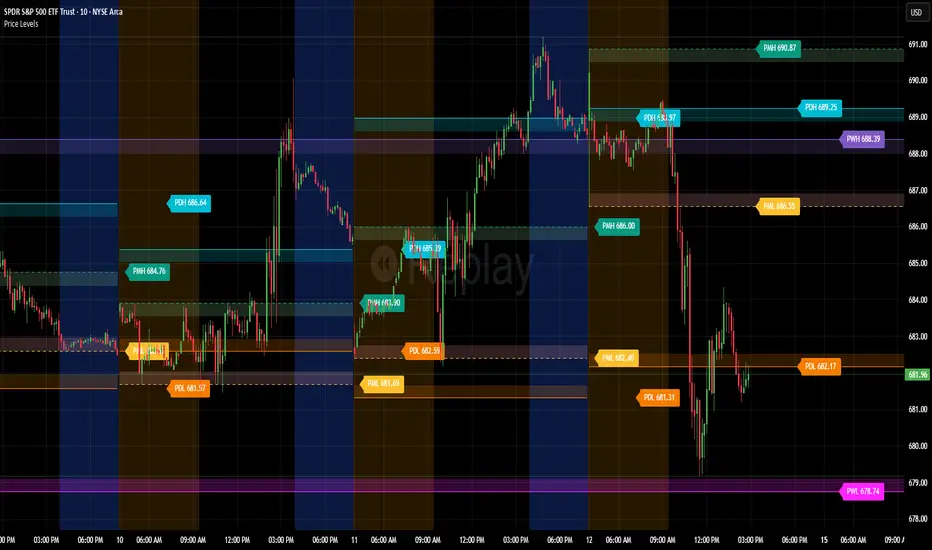
"Support and resistance are rarely exact lines; hey are zones where price reacts."
This indicator upgrades standard horizontal levels by visualizing Liquidity Zones around the most critical intraday reference points: Pre-Market, Previous Day, and Previous Week Highs/Lows.
Unlike basic scripts that just draw thin lines, this tool combines the precision of exact price levels with the reality of market volatility. It offers deep customization, allowing you to separate line colors from zone colors, perfect for keeping your charts clean and professional.
Key Features
1. Dual Zone Logic (Dynamic Sizing)
• Price Tier Mode (Default): Zones are sized based on the asset price (e.g., higher-priced stocks get wider zones automatically). This mimics "psychological" levels.
• ATR Volatility Mode: Switches calculation to use the Average True Range (ATR). Zones expand during high volatility and contract during chop, adapting to the market conditions in real-time.
2. Ultimate Customization
• Separate Colors: You can finally set your Line Color (e.g., Bright Green) independently from your Zone Fill (e.g., Faint Grey).
• Individual Toggles: Turn the Line, Zone, or Label on/off individually for every single level.
• Line Styles: Differentiate daily levels (Solid) from weekly levels (Dashed) instantly.
3. The "Smart" Levels
• PM High/Low: Real-time Pre-Market tracking that freezes at the open.
• PD High/Low: Previous Day’s range.
• PW High/Low: Previous Week’s range (Critical for swing points).
---
Settings Guide
• Extension Style:
- Individual: Keeps history of levels for backtesting.
- Most Recent: Keeps the chart minimal by extending only today's levels.
• Zone Thickness Mode: Switch between "Price Tier" and "ATR Volatility".
• ATR Settings: Fully adjustable Length and Multiplier (when in ATR mode).
• Transparency: Global slider to control how subtle or bold the zones appear.
How to Trade This
• The "Trap": If price breaks a Line but fails to close outside the Zone, it is often a liquidity grab (fakeout).
• The Retest: Watch for price to break a level and use the Zone as a cushion for a bounce/retest entry.
This indicator upgrades standard horizontal levels by visualizing Liquidity Zones around the most critical intraday reference points: Pre-Market, Previous Day, and Previous Week Highs/Lows.
Unlike basic scripts that just draw thin lines, this tool combines the precision of exact price levels with the reality of market volatility. It offers deep customization, allowing you to separate line colors from zone colors, perfect for keeping your charts clean and professional.
Key Features
1. Dual Zone Logic (Dynamic Sizing)
• Price Tier Mode (Default): Zones are sized based on the asset price (e.g., higher-priced stocks get wider zones automatically). This mimics "psychological" levels.
• ATR Volatility Mode: Switches calculation to use the Average True Range (ATR). Zones expand during high volatility and contract during chop, adapting to the market conditions in real-time.
2. Ultimate Customization
• Separate Colors: You can finally set your Line Color (e.g., Bright Green) independently from your Zone Fill (e.g., Faint Grey).
• Individual Toggles: Turn the Line, Zone, or Label on/off individually for every single level.
• Line Styles: Differentiate daily levels (Solid) from weekly levels (Dashed) instantly.
3. The "Smart" Levels
• PM High/Low: Real-time Pre-Market tracking that freezes at the open.
• PD High/Low: Previous Day’s range.
• PW High/Low: Previous Week’s range (Critical for swing points).
---
Settings Guide
• Extension Style:
- Individual: Keeps history of levels for backtesting.
- Most Recent: Keeps the chart minimal by extending only today's levels.
• Zone Thickness Mode: Switch between "Price Tier" and "ATR Volatility".
• ATR Settings: Fully adjustable Length and Multiplier (when in ATR mode).
• Transparency: Global slider to control how subtle or bold the zones appear.
How to Trade This
• The "Trap": If price breaks a Line but fails to close outside the Zone, it is often a liquidity grab (fakeout).
• The Retest: Watch for price to break a level and use the Zone as a cushion for a bounce/retest entry.
Catatan Rilis
Changelog: v1.1 New Features & Improvements
- Horizontal Label Offset: Added a specific input "Move Label (Left/Right)" for every level where positive values move right and negative move left.
- Staggered Defaults: Default offsets are now staggered (PM +3, PD +8, PW +13) to automatically prevent labels from piling on top of each other.
- Default Zone Precision: Set default zone thickness to ATR Volatility (0.05 Multiplier) for tighter, more precise zones.
Catatan Rilis
Changelog v1.2- Added an automated Multi-Timeframe (MTF) engine to detect Supply and Demand zones.
- Replaced manual price inputs with algorithmic Swing High/Low detection.
- Added a new settings group named "Automated Day Trade Zones".
- Included a Timeframe Selector for zones (default set to 4-Hour/240min).
Catatan Rilis
Changelog- Smart SPY-to-Index Mapping: The indicator now has a "Mapping" mode specifically for indices like SPX that don't have their own pre-market data.
- Dynamic Price Conversion: Instead of a fixed number, the tool now looks at the closing prices of both SPY and SPX from yesterday. It uses that ratio to "translate" SPY's pre-market high and low into exact SPX price levels.
- Built-in Info Table: You can now toggle a small dashboard on your chart. It shows you the raw SPY prices, the calculated conversion ratio, and the final levels, so you can verify the math at a glance.
- Exchange Selection: You can now specify which exchange to pull SPY data from (like AMEX or NYSE) to ensure the data matches your preferred source.
- Integrated Levels: The converted SPY levels now replace the standard pre-market lines when mapping is turned on. This keeps your chart clean by using your existing "PM High" and "PM Low" settings for these new calculated levels.
- Improved Calculation Logic: The script now uses a "tracking" function that monitors pre-market activity bar-by-bar, ensuring it captures the absolute highest and lowest points of the early morning session more reliably.
- Advanced Tooltips: Added helpful descriptions inside the settings menu to explain exactly how the conversion math works if you ever need a refresher.
- One-Click Toggle: You can easily switch between "Native" pre-market (the chart's own data) and "Derived" pre-market (the calculated SPY data) using a single checkbox.
Catatan Rilis
- Fix for other tickers
Catatan Rilis
Changelog1. Works Without Extended Hours: The indicator no longer depends on the chart's "Extended Trading Hours" toggle. Pre-market, prior day, and prior week levels are pulled from their own dedicated data feeds, so you get the same levels whether ETH is on or off.
2. Works On Any Timeframe: Levels now draw on daily, weekly, and monthly charts as well as intraday. Previously the whole script was locked to intraday only and drew nothing above a 1-hour chart.
3. Corrected Prior Day High/Low: On extended-hours charts the old version was reading the current day's high and low instead of yesterday's, so at the open your "PD High" was actually today's pre-market high. It now always reads the previous completed session.
4. Pre-Market Source Selector: Replaces the old SPY checkbox with four modes: Auto, Chart Symbol, Proxy Symbol, and Off. Auto uses the symbol's own pre-market data and only falls back to the proxy when the symbol has none, so it handles SPX and regular stocks without touching a setting.
5. More Proxy Options: SPY, QQQ, IWM, DIA, ES, and NQ are built in, plus a free text field for anything else. Useful if you prefer futures over the ETF for overnight levels.
6. Custom Pre-Market Window: For instruments with no defined pre-market session, such as futures, you can now define your own overnight window instead of relying on the exchange's session data.
7. Choose Your Range Basis: A new setting decides whether Prior Day and Prior Week high/low come from regular hours only or include extended hours. This used to be decided silently by your chart settings.
8. Cleaner Mornings: Previous days' labels no longer carry over onto the current session. Each level now keeps one label that follows the live day, while all the historical lines and zones stay exactly where they were.
9. No More Overshoot: Yesterday's lines and zones now stop at yesterday's last bar instead of extending one bar into the new session.
10. Fixed Alerts: Cross alerts were being evaluated inside a conditional block, which corrupted their internal state and caused missed and false triggers. They now evaluate on every bar. A new setting controls whether alerts fire outside regular hours.
11. Honest Zone Widths: The ATR used for zone thickness was reading the completed daily bar, meaning historical zones were drawn using data that would not have been available at the time. It now uses the previous day's ATR, so what you see on history matches what you would have seen live.
12. Expanded Info Table: The dashboard now shows which source is actually in use, the scan timeframe, the symbol's native pre-market values and the proxy values side by side, the conversion ratio, and the final resolved levels. You can see at a glance whether the proxy math is drifting.
13. Named Supply and Demand Zones: The automated MTF levels are now labelled S1, S2, D1, and D2, drawn as dotted white lines. Their labels were previously rendering as blank white boxes because the text colour matched the background. Label text colour is now derived automatically from whatever colour you pick.
14. Optional Zone Fill For MTF Levels: The supply and demand boxes can be turned off so those levels show as lines only, which keeps the chart readable when several cluster together.
15. History Control: A new "History window" setting limits how far back level segments are drawn, so the script no longer risks hitting TradingView's 500-object drawing limit on long charts.
16. New Defaults: Levels are now named PMH, PML, PDH, PDL, PWH, and PWL, with prices removed from the labels for a tighter look. Colours and line styles have been refreshed and zone width is now 0.03 x ATR.
Note: input names changed, so your previous settings will not carry over. Reconfigure once from the new defaults.
Skrip open-source
Dengan semangat TradingView yang sesungguhnya, pembuat skrip ini telah menjadikannya sebagai sumber terbuka, sehingga para trader dapat meninjau dan memverifikasi fungsinya. Salut untuk penulisnya! Meskipun Anda dapat menggunakannya secara gratis, perlu diingat bahwa penerbitan ulang kode ini tunduk pada Tata Tertib kami.

Pernyataan Penyangkalan
Informasi dan publikasi ini tidak dimaksudkan, dan bukan merupakan, saran atau rekomendasi keuangan, investasi, trading, atau jenis lainnya yang diberikan atau didukung oleh TradingView. Baca selengkapnya di Ketentuan Penggunaan.
Skrip open-source
Dengan semangat TradingView yang sesungguhnya, pembuat skrip ini telah menjadikannya sebagai sumber terbuka, sehingga para trader dapat meninjau dan memverifikasi fungsinya. Salut untuk penulisnya! Meskipun Anda dapat menggunakannya secara gratis, perlu diingat bahwa penerbitan ulang kode ini tunduk pada Tata Tertib kami.
Pernyataan Penyangkalan
Informasi dan publikasi ini tidak dimaksudkan, dan bukan merupakan, saran atau rekomendasi keuangan, investasi, trading, atau jenis lainnya yang diberikan atau didukung oleh TradingView. Baca selengkapnya di Ketentuan Penggunaan.