ATK/DEF Major Structure Dynamics
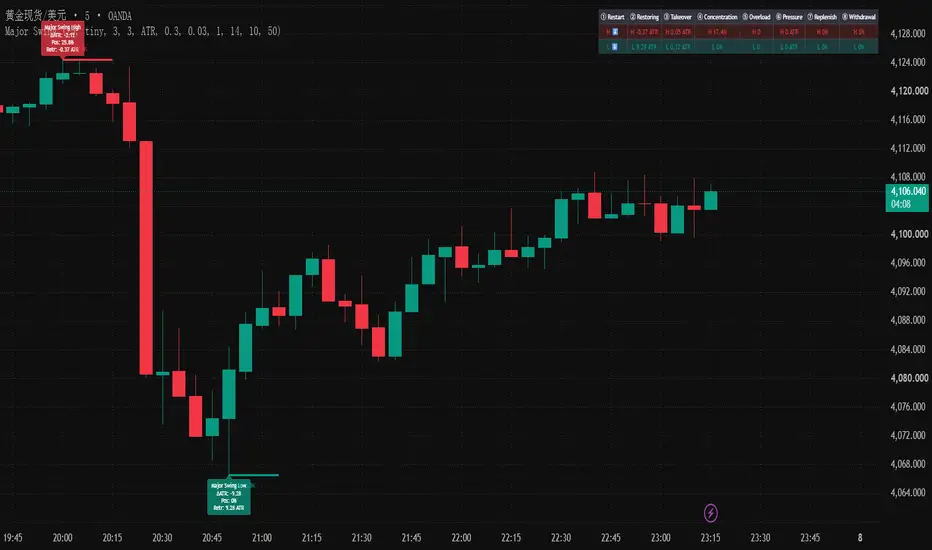
ATK/DEF Major Structure Dynamics is a major-scale market structure observation framework built around Major Swing High / Low.
The framework focuses on the structural behavior of Major Swings across a defined reference window, with eight core dimensions describing the progression of the current Major structure.
## Major Swing Structure
Major Swing High and Major Swing Low are generated from a configurable Pivot Length.
Each Major Swing records its structural position and subsequent interaction, including:
* Major Swing High
* Major Swing Low
* ATR reference
* Position
* Retracement
* Volume
* Touch count
* Structural break
* Post-break extension
* Structural return
The framework maintains separate Major High and Major Low records and tracks their structural changes over time.
## Major Structure Dynamics
The primary focus of the framework is the following eight structural dimensions:
### ① Restart
Records the direction of the oldest Swing within the reference window.
This identifies which side started the current Major structure.
### ② Restoring
Measures the distance from the current Major Swing to the previous opposite Major Swing, normalized by ATR.
A higher value represents a larger structural movement.
### ③ Takeover
Measures the movement speed of the most recent same-direction Major Swings, normalized by ATR.
A higher value represents greater relative movement intensity.
### ④ Concentration
Measures the current Major Swing's position within the reference range.
**0%** represents the low of the reference range, while **100%** represents the high.
### ⑤ Overload
Records how many times the current Major Swing level has been touched.
The value represents the accumulated structural interactions with the Major level.
### ⑥ Pressure
After the Major Swing is broken, measures how far price extends beyond the Major level, normalized by ATR.
The value represents the post-break extension from the original Major structure.
### ⑦ Replenish
When the Major Swing is broken and price subsequently returns, measures how much of the reference range is recovered.
### ⑧ Withdrawal
After the Major Swing is broken, measures how far price remains outside the original Major Swing level.
## Major Market Table
The market table organizes Major Swing High and Major Swing Low into the eight structural dimensions:
**Restart → Restoring → Takeover → Concentration → Overload → Pressure → Replenish → Withdrawal**
Separate **H / L** values are displayed for the corresponding Major Swing structures.
The table provides directional reference, ATR-normalized structural movement, movement intensity, reference-range position, touch count, post-break extension, recovery, and remaining displacement outside the Major level.
## Display
Configurable components include:
* Major Swing Pivot Length
* High / Low Display
* High / Low Colors
* ATR Length
* Deduplication Mode
* ATR / Percent / Points Reference
* ATR Deviation
* Position
* Retracement
* Volume
* Reference Swing Range
* Major Market Table
## Scope
For market observation and user-defined technical analysis only.
The framework focuses on the structural behavior of Major Swings across a defined reference window, with eight core dimensions describing the progression of the current Major structure.
## Major Swing Structure
Major Swing High and Major Swing Low are generated from a configurable Pivot Length.
Each Major Swing records its structural position and subsequent interaction, including:
* Major Swing High
* Major Swing Low
* ATR reference
* Position
* Retracement
* Volume
* Touch count
* Structural break
* Post-break extension
* Structural return
The framework maintains separate Major High and Major Low records and tracks their structural changes over time.
## Major Structure Dynamics
The primary focus of the framework is the following eight structural dimensions:
### ① Restart
Records the direction of the oldest Swing within the reference window.
This identifies which side started the current Major structure.
### ② Restoring
Measures the distance from the current Major Swing to the previous opposite Major Swing, normalized by ATR.
A higher value represents a larger structural movement.
### ③ Takeover
Measures the movement speed of the most recent same-direction Major Swings, normalized by ATR.
A higher value represents greater relative movement intensity.
### ④ Concentration
Measures the current Major Swing's position within the reference range.
**0%** represents the low of the reference range, while **100%** represents the high.
### ⑤ Overload
Records how many times the current Major Swing level has been touched.
The value represents the accumulated structural interactions with the Major level.
### ⑥ Pressure
After the Major Swing is broken, measures how far price extends beyond the Major level, normalized by ATR.
The value represents the post-break extension from the original Major structure.
### ⑦ Replenish
When the Major Swing is broken and price subsequently returns, measures how much of the reference range is recovered.
### ⑧ Withdrawal
After the Major Swing is broken, measures how far price remains outside the original Major Swing level.
## Major Market Table
The market table organizes Major Swing High and Major Swing Low into the eight structural dimensions:
**Restart → Restoring → Takeover → Concentration → Overload → Pressure → Replenish → Withdrawal**
Separate **H / L** values are displayed for the corresponding Major Swing structures.
The table provides directional reference, ATR-normalized structural movement, movement intensity, reference-range position, touch count, post-break extension, recovery, and remaining displacement outside the Major level.
## Display
Configurable components include:
* Major Swing Pivot Length
* High / Low Display
* High / Low Colors
* ATR Length
* Deduplication Mode
* ATR / Percent / Points Reference
* ATR Deviation
* Position
* Retracement
* Volume
* Reference Swing Range
* Major Market Table
## Scope
For market observation and user-defined technical analysis only.

Pernyataan Penyangkalan
Informasi dan publikasi ini tidak dimaksudkan, dan bukan merupakan, saran atau rekomendasi keuangan, investasi, trading, atau jenis lainnya yang diberikan atau didukung oleh TradingView. Baca selengkapnya di Ketentuan Penggunaan.
Pernyataan Penyangkalan
Informasi dan publikasi ini tidak dimaksudkan, dan bukan merupakan, saran atau rekomendasi keuangan, investasi, trading, atau jenis lainnya yang diberikan atau didukung oleh TradingView. Baca selengkapnya di Ketentuan Penggunaan.