Daily maximum price range for Credit Spreads
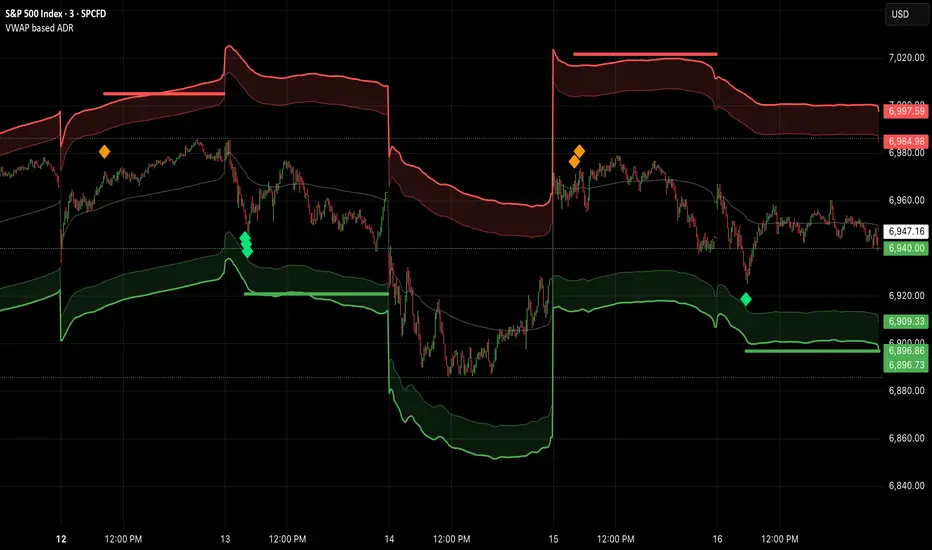
Volatility & Momentum for Credit Spreads
It is a specialized mean-reversion tool designed primarily for options traders focusing on Credit Spreads (specifically 0DTE on SPX) and intraday reversals. By combining Volume Weighted Average Price (VWAP) with VIX-adjusted volatility bands, this indicator identifies statistical extremes where price is likely to revert.
Unlike standard Bollinger Bands or Keltner Channels, TITAN adapts its width based on real-time implied volatility (VIX), ensuring that your "overextended" zones are accurate whether the market is calm or chaotic.
🎯 Core Concept
The indicator relies on the principle that price moves within a definable "Daily Range" relative to the VWAP. When price pushes to the outer limits of this range while simultaneously hitting RSI extremes; it signals a high-probability reversal setup ideal for selling premium.
🛠 How It Works
The engine is built on three pillars:
🚀 Key Features
📉 How to Trade It (Example Strategy)
⚙️ Settings
⚠️ Disclaimer
This tool is for informational purposes only. Trading options, especially 0DTE credit spreads, involves significant risk. Always backtest strategies and manage risk accordingly.
It is a specialized mean-reversion tool designed primarily for options traders focusing on Credit Spreads (specifically 0DTE on SPX) and intraday reversals. By combining Volume Weighted Average Price (VWAP) with VIX-adjusted volatility bands, this indicator identifies statistical extremes where price is likely to revert.
Unlike standard Bollinger Bands or Keltner Channels, TITAN adapts its width based on real-time implied volatility (VIX), ensuring that your "overextended" zones are accurate whether the market is calm or chaotic.
🎯 Core Concept
The indicator relies on the principle that price moves within a definable "Daily Range" relative to the VWAP. When price pushes to the outer limits of this range while simultaneously hitting RSI extremes; it signals a high-probability reversal setup ideal for selling premium.
🛠 How It Works
The engine is built on three pillars:
- Volatility-Adaptive Bands: The bands are calculated using a 14-day Average Daily Range (ADR), which is then dynamically scaled by the current VIX relative to a baseline. If VIX spikes, the bands widen instantly to keep you safe from premature entries.
- Momentum Triggers: Signals are generated only when the RSI (14) hits extreme Overbought (>70) or Oversold (<30) levels.
- "Golden Hour" Filtering: To avoid market open noise or late-day chop, the indicator includes a customizable time filter (Default: 10:15 – 11:30 AM EST). Signals outside this window are suppressed to enforce trading discipline.
🚀 Key Features
- Visual Strategy Simulation: The indicator now includes a built-in "Strike Simulator." Upon the first valid signal of the session, it automatically plots a horizontal "Strike Line" at the Outer Band ± a user-defined buffer (e.g., 10 points). This helps you visualize your theoretical strike price for the rest of the day.
- Bull & Bear Zones: Color-coded fills (Green for Bullish Buy Zones, Red for Bearish Sell Zones) make it easy to see market context at a glance.
- Live Dashboard: A Heads-Up Display (HUD) in the bottom right shows real-time RSI values, Golden Hour status, and current signal state.
- Unified Alert System: A single master alert condition triggers if price hits an RSI extreme OR touches a volatility band during your active trading window.
📉 How to Trade It (Example Strategy)
- Wait for the Window: Ensure the "Golden Hour" on the dashboard reads ACTIVE (Default 10:15 AM EST).
- Identify the Zone: Short Setup (Call Credit Spread): Price pushes into the Red Zone (Outer High). Long Setup (Put Credit Spread): Price pushes into the Green Zone (Outer Low).
- Confirm the Signal: Look for the Diamond Icon. This confirms RSI has hit the extreme threshold.
- Check the "Strike Line": Use the simulated horizontal line to identify where your short strike would be (Outer Band + Buffer) to verify it is at a safe distance from current price.
⚙️ Settings
- ADR Length: Lookback period for daily range calculation (Default: 10).
- Baseline VIX:* The standard VIX level used for normalization (Default: 15.0).
- Inner/Outer Multipliers: Controls the width of the bands.
- Golden Hour: The specific time window for valid signals.
- Strike Buffer: Points added to the outer band to simulate your option strike price.
⚠️ Disclaimer
This tool is for informational purposes only. Trading options, especially 0DTE credit spreads, involves significant risk. Always backtest strategies and manage risk accordingly.

Pernyataan Penyangkalan
Informasi dan publikasi ini tidak dimaksudkan, dan bukan merupakan, saran atau rekomendasi keuangan, investasi, trading, atau jenis lainnya yang diberikan atau didukung oleh TradingView. Baca selengkapnya di Ketentuan Penggunaan.
Pernyataan Penyangkalan
Informasi dan publikasi ini tidak dimaksudkan, dan bukan merupakan, saran atau rekomendasi keuangan, investasi, trading, atau jenis lainnya yang diberikan atau didukung oleh TradingView. Baca selengkapnya di Ketentuan Penggunaan.