Diupdate
The Islnd Tap and Fill
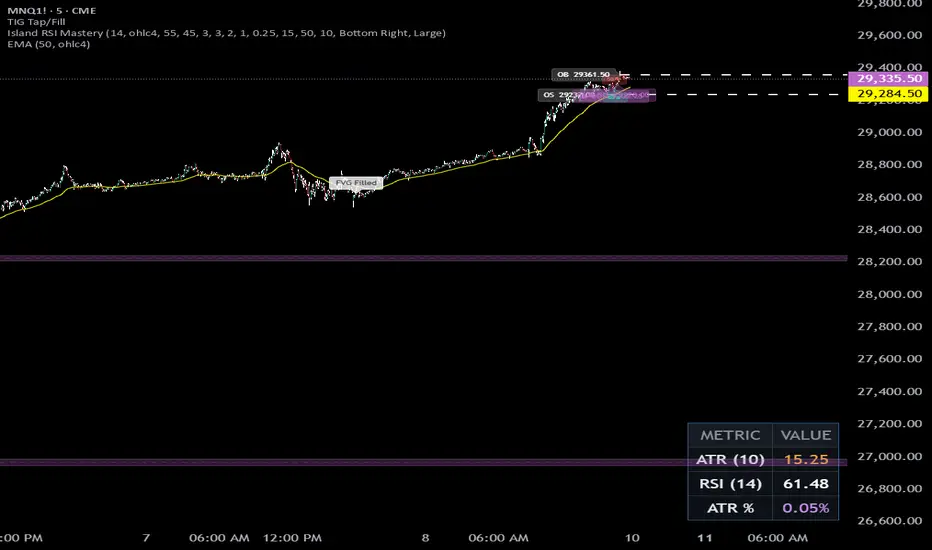
The Islnd Tap and Fill indicator automatically identifies and visualizes Bullish and Bearish Gaps using a three‑candle pattern.
It plots colored zones extended to the right, draws an optional midline with price labels, and tracks each gap’s lifecycle.
When price first trades back into a gap, the indicator marks a “Tap”; when price fully closes through the gap, it removes the zone and associated markings and prints an “FVG Filled” label.
This provides a clear, structured view of where price has left and later revisited imbalanced areas, supporting precise entry, management, and exit decisions.
It plots colored zones extended to the right, draws an optional midline with price labels, and tracks each gap’s lifecycle.
When price first trades back into a gap, the indicator marks a “Tap”; when price fully closes through the gap, it removes the zone and associated markings and prints an “FVG Filled” label.
This provides a clear, structured view of where price has left and later revisited imbalanced areas, supporting precise entry, management, and exit decisions.
Catatan Rilis
Improved v2.0
Pernyataan Penyangkalan
Informasi dan publikasi ini tidak dimaksudkan, dan bukan merupakan, saran atau rekomendasi keuangan, investasi, trading, atau jenis lainnya yang diberikan atau didukung oleh TradingView. Baca selengkapnya di Ketentuan Penggunaan.
Pernyataan Penyangkalan
Informasi dan publikasi ini tidak dimaksudkan, dan bukan merupakan, saran atau rekomendasi keuangan, investasi, trading, atau jenis lainnya yang diberikan atau didukung oleh TradingView. Baca selengkapnya di Ketentuan Penggunaan.