OPEN-SOURCE SCRIPT
Diupdate Strong Weak Highs Lows
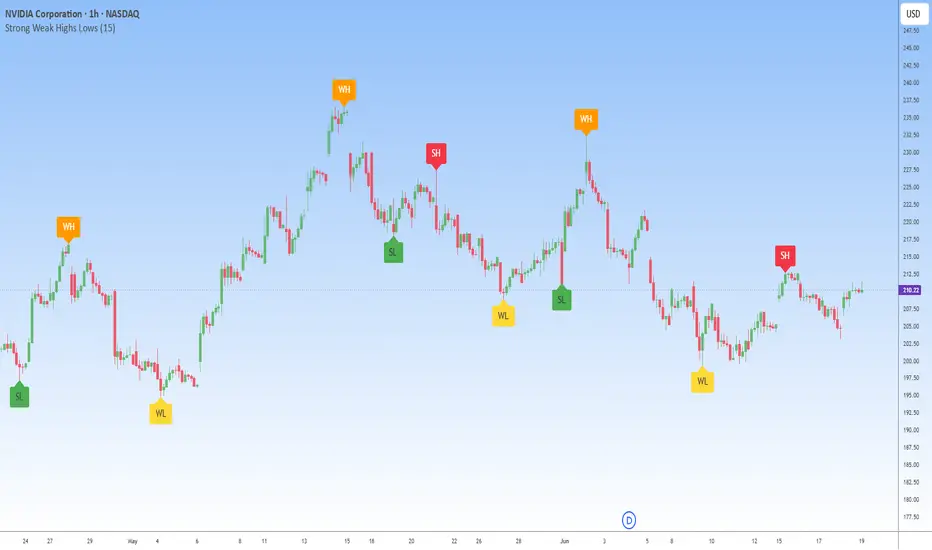
strong Weak Highs & Lows is a market structure indicator that automatically classifies swing points based on price behavior and trend context. Instead of simply plotting highs and lows, it helps traders distinguish between levels that are likely to hold and levels that are more vulnerable to being broken.
The indicator identifies:
* **WH (Weak High)**
* **SH (Strong High)**
* **WL (Weak Low)**
* **SL (Strong Low)**
This provides a clearer view of liquidity, market intent, and potential breakout targets.
Understanding the Labels
Weak High (WH)
A Weak High is a swing high that has a higher probability of being broken in the future.
Characteristics:
* Usually forms during bullish market conditions.
* Indicates buyers remain in control.
* Often becomes a future liquidity target.
Strong High (SH)
A Strong High is a swing high that successfully rejects price and is more likely to hold.
Characteristics:
* Often forms during bearish conditions.
* Indicates seller presence.
* Acts as a potential resistance level.
Weak Low (WL)
A Weak Low is a swing low that has a higher probability of being broken.
Characteristics:
* Common during bearish trends.
* Indicates continued downside pressure.
* Frequently becomes a liquidity target.
Strong Low (SL)
A Strong Low is a swing low that successfully defends against further selling.
Characteristics:
* Often forms during bullish conditions.
* Indicates buyer strength.
* Acts as potential support.
What the Chart Demonstrates
Using the NVIDIA (NVDA) 1H chart:
📈 During bullish phases, the indicator identified multiple **Weak Highs (WH)** while marking **Strong Lows (SL)** beneath price, highlighting continued buyer dominance.
📉 As momentum weakened, **Strong Highs (SH)** began appearing near market turning points, signaling increasing seller control.
🎯 Weak levels often became natural liquidity targets before price reversed or continued its trend.
🔄 The ongoing alternation between strong and weak swing points provides valuable context for anticipating future market structure developments.
Why This Matters
Many traders focus solely on where highs and lows are located.
Professional price action analysis also considers:
* Which highs are likely to be broken
* Which lows are likely to hold
* Where liquidity is resting
* Where stop orders may be clustered
* Which side currently controls market structure
Strong Weak Highs & Lows helps visualize these concepts automatically.
Features
✔ Automatic swing detection
✔ Strong vs Weak classification
✔ Liquidity target identification
✔ Market structure context
✔ Clean chart visualization
✔ Non-repainting swing confirmation
✔ Multi-timeframe support
✔ Suitable for Smart Money Concepts (SMC)
How to Use
Bullish Environment
* Focus on Strong Lows (SL).
* Expect Weak Highs (WH) to be targeted and potentially broken.
* Look for continuation opportunities after pullbacks.
Bearish Environment
* Focus on Strong Highs (SH).
* Expect Weak Lows (WL) to be targeted and potentially broken.
* Look for selling opportunities during retracements.
Liquidity Analysis
* Weak highs and weak lows often act as future liquidity magnets.
* Use them as potential target zones for trend continuation trades.
Best Applications
* Market Structure Trading
* Smart Money Concepts (SMC)
* Liquidity Analysis
* Swing Trading
* Trend Following
* Intraday Trading
* Higher Timeframe Confirmation
Notes
Strong and Weak classifications are based on market structure behavior and are not direct buy or sell signals. The indicator is designed to help traders understand the strength behind swing points and improve decision-making around support, resistance, and liquidity.
For best results, combine with:
* Break of Structure (BOS)
* Change of Character (CHoCH)
* Supply & Demand Zones
* Risk Management Rules
Strong Weak Highs & Lows transforms ordinary swing analysis into actionable market structure insight by identifying which levels are likely to hold and which levels are likely to become future liquidity targets.
The indicator identifies:
* **WH (Weak High)**
* **SH (Strong High)**
* **WL (Weak Low)**
* **SL (Strong Low)**
This provides a clearer view of liquidity, market intent, and potential breakout targets.
Understanding the Labels
Weak High (WH)
A Weak High is a swing high that has a higher probability of being broken in the future.
Characteristics:
* Usually forms during bullish market conditions.
* Indicates buyers remain in control.
* Often becomes a future liquidity target.
Strong High (SH)
A Strong High is a swing high that successfully rejects price and is more likely to hold.
Characteristics:
* Often forms during bearish conditions.
* Indicates seller presence.
* Acts as a potential resistance level.
Weak Low (WL)
A Weak Low is a swing low that has a higher probability of being broken.
Characteristics:
* Common during bearish trends.
* Indicates continued downside pressure.
* Frequently becomes a liquidity target.
Strong Low (SL)
A Strong Low is a swing low that successfully defends against further selling.
Characteristics:
* Often forms during bullish conditions.
* Indicates buyer strength.
* Acts as potential support.
What the Chart Demonstrates
Using the NVIDIA (NVDA) 1H chart:
📈 During bullish phases, the indicator identified multiple **Weak Highs (WH)** while marking **Strong Lows (SL)** beneath price, highlighting continued buyer dominance.
📉 As momentum weakened, **Strong Highs (SH)** began appearing near market turning points, signaling increasing seller control.
🎯 Weak levels often became natural liquidity targets before price reversed or continued its trend.
🔄 The ongoing alternation between strong and weak swing points provides valuable context for anticipating future market structure developments.
Why This Matters
Many traders focus solely on where highs and lows are located.
Professional price action analysis also considers:
* Which highs are likely to be broken
* Which lows are likely to hold
* Where liquidity is resting
* Where stop orders may be clustered
* Which side currently controls market structure
Strong Weak Highs & Lows helps visualize these concepts automatically.
Features
✔ Automatic swing detection
✔ Strong vs Weak classification
✔ Liquidity target identification
✔ Market structure context
✔ Clean chart visualization
✔ Non-repainting swing confirmation
✔ Multi-timeframe support
✔ Suitable for Smart Money Concepts (SMC)
How to Use
Bullish Environment
* Focus on Strong Lows (SL).
* Expect Weak Highs (WH) to be targeted and potentially broken.
* Look for continuation opportunities after pullbacks.
Bearish Environment
* Focus on Strong Highs (SH).
* Expect Weak Lows (WL) to be targeted and potentially broken.
* Look for selling opportunities during retracements.
Liquidity Analysis
* Weak highs and weak lows often act as future liquidity magnets.
* Use them as potential target zones for trend continuation trades.
Best Applications
* Market Structure Trading
* Smart Money Concepts (SMC)
* Liquidity Analysis
* Swing Trading
* Trend Following
* Intraday Trading
* Higher Timeframe Confirmation
Notes
Strong and Weak classifications are based on market structure behavior and are not direct buy or sell signals. The indicator is designed to help traders understand the strength behind swing points and improve decision-making around support, resistance, and liquidity.
For best results, combine with:
* Break of Structure (BOS)
* Change of Character (CHoCH)
* Supply & Demand Zones
* Risk Management Rules
Strong Weak Highs & Lows transforms ordinary swing analysis into actionable market structure insight by identifying which levels are likely to hold and which levels are likely to become future liquidity targets.
Catatan Rilis
Update Notes - What's New
🔹 Improved Swing Detection
>Enhanced swing high and low identification for more consistent market structure analysis.
>Better filtering of minor price fluctuations to reduce unnecessary labels.
🔹 Refined Strong/Weak Classification
>Improved logic for identifying Strong Highs (SH) and Strong Lows (SL).
>More accurate detection of Weak Highs (WH) and Weak Lows (WL) based on market structure.
🔹 Cleaner Chart Display
>Optimized label placement to minimize overlap during volatile market conditions.
>Improved readability across all supported timeframes.
🔹 Enhanced Market Structure Logic
>Better recognition of trend continuation and reversal scenarios.
>Increased reliability when identifying potential liquidity targets.
🔹 Performance Optimizations
>Reduced computational overhead for smoother real-time updates.
>Improved script efficiency without changing the core functionality.
🔹 Multi-Timeframe Compatibility
>Improved consistency across lower and higher timeframes.
>Better adaptation to different market conditions and asset classes.
Fixed
Fixed occasional duplicate swing labels.
Improved handling of consecutive highs and lows in strong trending markets.
Reduced false classifications caused by short-term market noise.
Corrected label positioning in certain edge cases.
Compatible With
- Stocks
- Forex
- Crypto
- Indices
- Commodities
Reminder
Strong Weak Highs & Lows is a market structure and liquidity analysis tool, not a standalone buy or sell signal indicator. For best results, combine it with trend analysis, support and resistance, or other price action concepts.
Thank you for your feedback and support! More enhancements and features are planned for future updates.
Skrip open-source
Dengan semangat TradingView yang sesungguhnya, pembuat skrip ini telah menjadikannya sebagai sumber terbuka, sehingga para trader dapat meninjau dan memverifikasi fungsinya. Salut untuk penulisnya! Meskipun Anda dapat menggunakannya secara gratis, perlu diingat bahwa penerbitan ulang kode ini tunduk pada Tata Tertib kami.

📈 FREE TELEGRAM CHANNEL
🥇 Free Daily Forex, Gold & BTC Trade Signals
📚 Daily Trading Lessons & Technical Analysis
Learn, improve, and follow the market with us — completely FREE.
📲 Join Now: t.me/JosProTrader_050
🥇 Free Daily Forex, Gold & BTC Trade Signals
📚 Daily Trading Lessons & Technical Analysis
Learn, improve, and follow the market with us — completely FREE.
📲 Join Now: t.me/JosProTrader_050
Pernyataan Penyangkalan
Informasi dan publikasi ini tidak dimaksudkan, dan bukan merupakan, saran atau rekomendasi keuangan, investasi, trading, atau jenis lainnya yang diberikan atau didukung oleh TradingView. Baca selengkapnya di Ketentuan Penggunaan.
Skrip open-source
Dengan semangat TradingView yang sesungguhnya, pembuat skrip ini telah menjadikannya sebagai sumber terbuka, sehingga para trader dapat meninjau dan memverifikasi fungsinya. Salut untuk penulisnya! Meskipun Anda dapat menggunakannya secara gratis, perlu diingat bahwa penerbitan ulang kode ini tunduk pada Tata Tertib kami.
📈 FREE TELEGRAM CHANNEL
🥇 Free Daily Forex, Gold & BTC Trade Signals
📚 Daily Trading Lessons & Technical Analysis
Learn, improve, and follow the market with us — completely FREE.
📲 Join Now: t.me/JosProTrader_050
🥇 Free Daily Forex, Gold & BTC Trade Signals
📚 Daily Trading Lessons & Technical Analysis
Learn, improve, and follow the market with us — completely FREE.
📲 Join Now: t.me/JosProTrader_050
Pernyataan Penyangkalan
Informasi dan publikasi ini tidak dimaksudkan, dan bukan merupakan, saran atau rekomendasi keuangan, investasi, trading, atau jenis lainnya yang diberikan atau didukung oleh TradingView. Baca selengkapnya di Ketentuan Penggunaan.