Diupdate
[Tiestobob] Previous Day and Overnight Highs/Lows
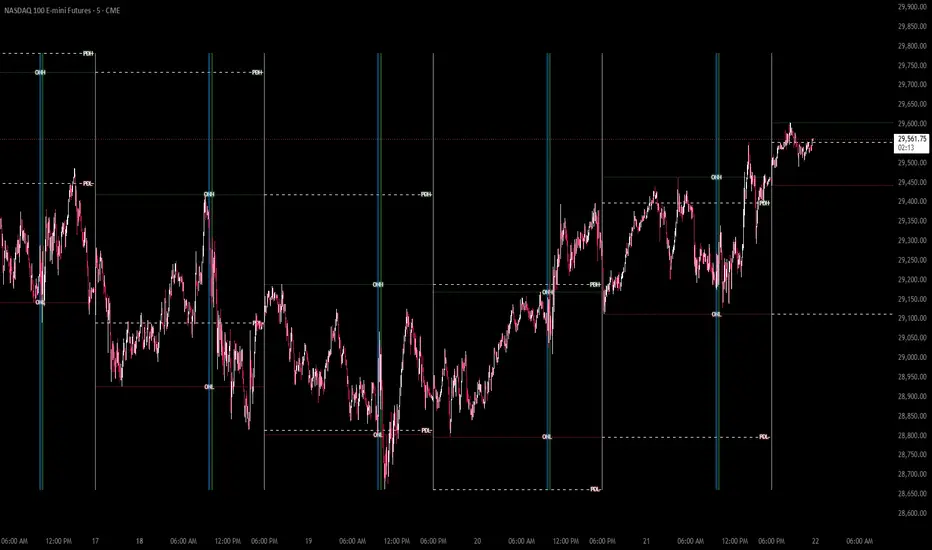
**[Tiestobob] Previous Day and Overnight Highs/Lows**
This indicator plots two of the most widely watched price levels used by intraday traders — the **Previous Day High/Low (PDH/PDL)** and the **Overnight High/Low (ONH/ONL)** — directly on your chart, automatically adjusted for New York time (EST/EDT).
---
**📌 What It Does**
- **Previous Day H/L** — Draws dashed white lines at the prior trading day's high and low (6:00 PM – 4:00 PM ET session)
- **Overnight H/L** — Draws dotted green/red lines marking the high and low of the overnight session (6:00 PM – 9:30 AM ET), a key range watched by futures and forex traders before the regular market open
- Optional **H/L labels** (PDH, PDL, ONH, ONL) appear at the close of each session
- Lines can be **extended to the right** so levels remain visible throughout the trading day
---
**⚙️ Settings**
| Option | Description |
|---|---|
| Select what to plot | Choose between Previous Day H/L or Overnight H/L |
| Show H/L Labels | Toggle end-of-session labels on/off |
| Line Width | Adjust line thickness (1–3) |
| Extend Lines Right | Keep levels visible after the session ends |
---
**📋 Notes**
- All sessions are calculated using the **America/New_York** timezone, automatically accounting for daylight saving time
- Best used on intraday timeframes (1m, 5m, 15m, 1H)
- Pairs well with volume profile, VWAP, and market structure tools
---
*These levels are commonly used as areas of interest for reversals, breakouts, and liquidity sweeps. Use them as context — not signals.*
This indicator plots two of the most widely watched price levels used by intraday traders — the **Previous Day High/Low (PDH/PDL)** and the **Overnight High/Low (ONH/ONL)** — directly on your chart, automatically adjusted for New York time (EST/EDT).
---
**📌 What It Does**
- **Previous Day H/L** — Draws dashed white lines at the prior trading day's high and low (6:00 PM – 4:00 PM ET session)
- **Overnight H/L** — Draws dotted green/red lines marking the high and low of the overnight session (6:00 PM – 9:30 AM ET), a key range watched by futures and forex traders before the regular market open
- Optional **H/L labels** (PDH, PDL, ONH, ONL) appear at the close of each session
- Lines can be **extended to the right** so levels remain visible throughout the trading day
---
**⚙️ Settings**
| Option | Description |
|---|---|
| Select what to plot | Choose between Previous Day H/L or Overnight H/L |
| Show H/L Labels | Toggle end-of-session labels on/off |
| Line Width | Adjust line thickness (1–3) |
| Extend Lines Right | Keep levels visible after the session ends |
---
**📋 Notes**
- All sessions are calculated using the **America/New_York** timezone, automatically accounting for daylight saving time
- Best used on intraday timeframes (1m, 5m, 15m, 1H)
- Pairs well with volume profile, VWAP, and market structure tools
---
*These levels are commonly used as areas of interest for reversals, breakouts, and liquidity sweeps. Use them as context — not signals.*
Catatan Rilis
Lots of changes:-Added Both Previous Day and Overnight Highs/Lows
-Added Labels
-Clarified levels that are mitigated during and after session

Pernyataan Penyangkalan
Informasi dan publikasi ini tidak dimaksudkan, dan bukan merupakan, saran atau rekomendasi keuangan, investasi, trading, atau jenis lainnya yang diberikan atau didukung oleh TradingView. Baca selengkapnya di Ketentuan Penggunaan.
Pernyataan Penyangkalan
Informasi dan publikasi ini tidak dimaksudkan, dan bukan merupakan, saran atau rekomendasi keuangan, investasi, trading, atau jenis lainnya yang diberikan atau didukung oleh TradingView. Baca selengkapnya di Ketentuan Penggunaan.