MNQ Trend Bias PRO v2
# MNQ Trend Bias PRO v2
**MNQ Trend Bias PRO v2** is a multi-timeframe trend-bias and trade-signal indicator designed primarily for **Micro E-mini Nasdaq-100 (MNQ)** intraday trading.
The indicator combines a higher-timeframe trend filter with lower-timeframe execution conditions to identify bullish, bearish, and neutral market environments.
## Trend Bias
By default, trend direction is calculated from the **15-minute timeframe** using:
- 20 EMA position and slope
- Session VWAP position and slope
- Price relative to both EMA and VWAP
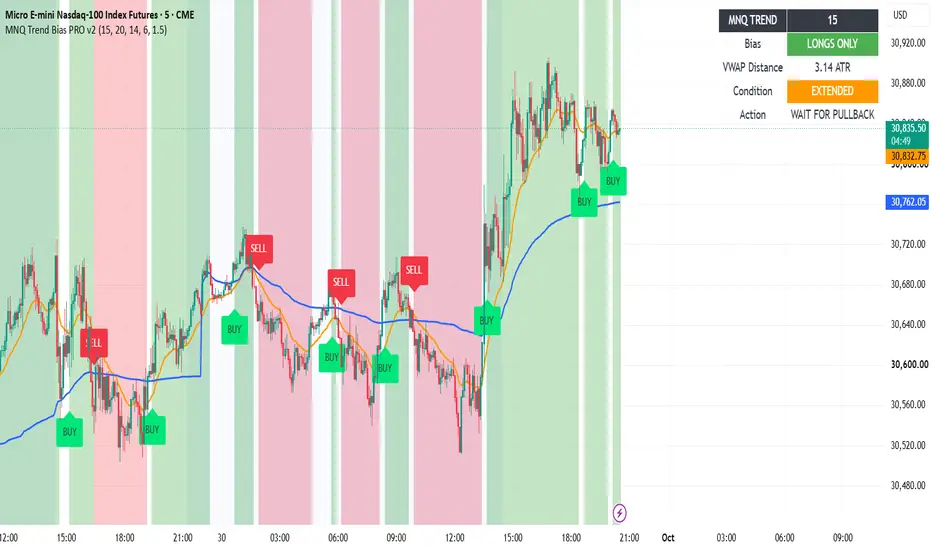
A **green background** represents bullish bias, a **red background** represents bearish bias, and a **grey background** represents a neutral or unconfirmed environment.
When the higher-timeframe bias changes:
**Green → BUY signal**
**Red → SELL signal**
These signals indicate a change in calculated trend bias. They are not a guarantee that price will continue in that direction.
## Breakout Signals
The indicator looks for momentum breakouts that agree with the higher-timeframe trend.
A breakout requires price to:
- Align with the higher-timeframe bias
- Break the recent high/low
- Remain on the correct side of the 20 EMA
- Remain on the correct side of VWAP
- Close with directional momentum
- Pass the VWAP-extension filter
Signals are displayed as **BRK BUY** and **BRK SELL**.
## Pullback Signals
The pullback system waits for price to move against the current trend and subsequently reclaim the 20 EMA.
For bullish setups, price must first close below the EMA and then reclaim it while bullish higher-timeframe conditions remain active.
The opposite conditions apply to bearish setups.
Signals are displayed as **PB BUY** and **PB SELL**.
## VWAP Extension Filter
The indicator measures the distance between price and VWAP relative to ATR.
The default maximum extension is **1.5 ATR from VWAP**. Signals that occur when price is excessively extended can therefore be filtered.
## Dashboard
The dashboard displays:
- Current higher-timeframe bias
- VWAP distance in ATR
- Current market condition
- Directional focus
## Default Settings
**Trend Bias Timeframe:** 15 minutes
**EMA Length:** 20
**ATR Length:** 14
**Breakout Lookback:** 6 bars
**Maximum VWAP Extension:** 1.5 ATR
## Alerts
Alerts are available for:
- Trend turns green — BUY
- Trend turns red — SELL
- Breakout BUY
- Breakout SELL
- Pullback BUY
- Pullback SELL
# ⚠️ IMPORTANT RISK WARNING
**TRADE AT YOUR OWN RISK.**
Futures trading involves substantial risk and can result in significant financial losses. This indicator does **not** guarantee profitable trades, accurate signals, or future performance.
BUY and SELL signals are generated mechanically from the conditions programmed into the indicator. They should **not** be interpreted as financial advice or as a recommendation to enter any particular trade.
False signals, rapid trend changes, slippage, volatility, gaps, execution delays, and unexpected market events can all result in losses.
Always:
- Use appropriate risk management.
- Determine your own stop-loss and position size.
- Test the indicator thoroughly before risking real capital.
- Never risk money you cannot afford to lose.
- Verify that the indicator suits your own trading approach and risk tolerance.
Past or backtested performance does not guarantee future results.
**You are solely responsible for your own trading decisions, trades, profits, and losses.**
This indicator is provided for **educational and informational purposes only** and does not constitute financial or investment advice.
**By using this indicator, you acknowledge that you trade entirely at your own risk.**
**MNQ Trend Bias PRO v2** is a multi-timeframe trend-bias and trade-signal indicator designed primarily for **Micro E-mini Nasdaq-100 (MNQ)** intraday trading.
The indicator combines a higher-timeframe trend filter with lower-timeframe execution conditions to identify bullish, bearish, and neutral market environments.
## Trend Bias
By default, trend direction is calculated from the **15-minute timeframe** using:
- 20 EMA position and slope
- Session VWAP position and slope
- Price relative to both EMA and VWAP
A **green background** represents bullish bias, a **red background** represents bearish bias, and a **grey background** represents a neutral or unconfirmed environment.
When the higher-timeframe bias changes:
**Green → BUY signal**
**Red → SELL signal**
These signals indicate a change in calculated trend bias. They are not a guarantee that price will continue in that direction.
## Breakout Signals
The indicator looks for momentum breakouts that agree with the higher-timeframe trend.
A breakout requires price to:
- Align with the higher-timeframe bias
- Break the recent high/low
- Remain on the correct side of the 20 EMA
- Remain on the correct side of VWAP
- Close with directional momentum
- Pass the VWAP-extension filter
Signals are displayed as **BRK BUY** and **BRK SELL**.
## Pullback Signals
The pullback system waits for price to move against the current trend and subsequently reclaim the 20 EMA.
For bullish setups, price must first close below the EMA and then reclaim it while bullish higher-timeframe conditions remain active.
The opposite conditions apply to bearish setups.
Signals are displayed as **PB BUY** and **PB SELL**.
## VWAP Extension Filter
The indicator measures the distance between price and VWAP relative to ATR.
The default maximum extension is **1.5 ATR from VWAP**. Signals that occur when price is excessively extended can therefore be filtered.
## Dashboard
The dashboard displays:
- Current higher-timeframe bias
- VWAP distance in ATR
- Current market condition
- Directional focus
## Default Settings
**Trend Bias Timeframe:** 15 minutes
**EMA Length:** 20
**ATR Length:** 14
**Breakout Lookback:** 6 bars
**Maximum VWAP Extension:** 1.5 ATR
## Alerts
Alerts are available for:
- Trend turns green — BUY
- Trend turns red — SELL
- Breakout BUY
- Breakout SELL
- Pullback BUY
- Pullback SELL
# ⚠️ IMPORTANT RISK WARNING
**TRADE AT YOUR OWN RISK.**
Futures trading involves substantial risk and can result in significant financial losses. This indicator does **not** guarantee profitable trades, accurate signals, or future performance.
BUY and SELL signals are generated mechanically from the conditions programmed into the indicator. They should **not** be interpreted as financial advice or as a recommendation to enter any particular trade.
False signals, rapid trend changes, slippage, volatility, gaps, execution delays, and unexpected market events can all result in losses.
Always:
- Use appropriate risk management.
- Determine your own stop-loss and position size.
- Test the indicator thoroughly before risking real capital.
- Never risk money you cannot afford to lose.
- Verify that the indicator suits your own trading approach and risk tolerance.
Past or backtested performance does not guarantee future results.
**You are solely responsible for your own trading decisions, trades, profits, and losses.**
This indicator is provided for **educational and informational purposes only** and does not constitute financial or investment advice.
**By using this indicator, you acknowledge that you trade entirely at your own risk.**

Pernyataan Penyangkalan
Informasi dan publikasi ini tidak dimaksudkan, dan bukan merupakan, saran atau rekomendasi keuangan, investasi, trading, atau jenis lainnya yang diberikan atau didukung oleh TradingView. Baca selengkapnya di Ketentuan Penggunaan.
Pernyataan Penyangkalan
Informasi dan publikasi ini tidak dimaksudkan, dan bukan merupakan, saran atau rekomendasi keuangan, investasi, trading, atau jenis lainnya yang diberikan atau didukung oleh TradingView. Baca selengkapnya di Ketentuan Penggunaan.