OPEN-SOURCE SCRIPT
Diupdate Koda Price Display
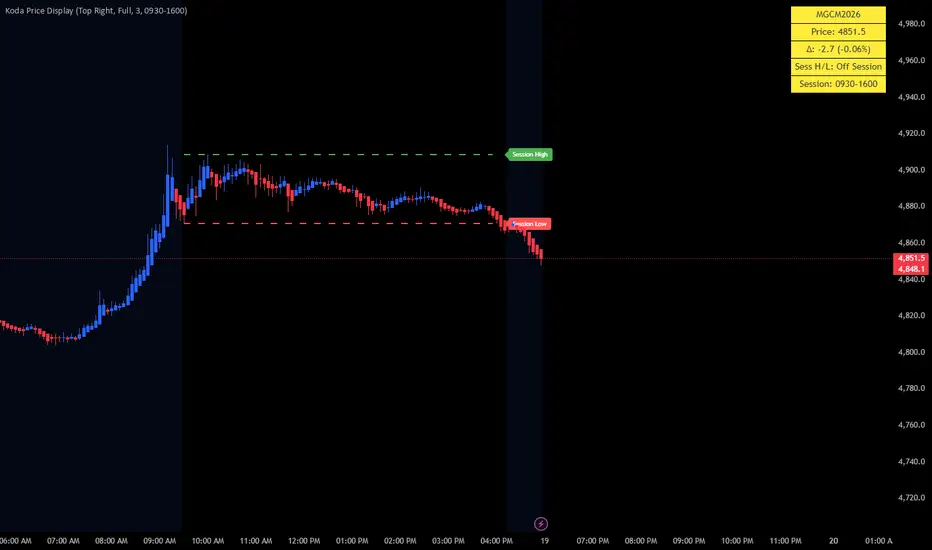
KODA PRICE DISPLAY
Koda Price Display — Complete How to Use Guide
🎯 What this indicator now does
This iindicator a real-time execution + session context tool.
It shows:
• Live price (with flashing momentum)
• Price change
• Session high & low (live updating)
• Session high/low lines on chart
• Session labels (cleanly offset)
• Movable dashboard
________________________________________
⚡ 1. Flashing Price = Micro Momentum
This is your execution timing tool
🟢 Green Flash
• Price just ticked UP
• Buyers stepping in
🔴 Red Flash
• Price just ticked DOWN
• Sellers stepping in
🟡 Yellow
• Neutral / no recent movement
________________________________________
🧠 How to use it
👉 Use flashing to confirm entries
Example:
• You want to go long
• Wait for green flashes before entering
________________________________________
💧 2. Session High & Low (Core Feature)
What it shows:
Sess H/L: 5285.00 / 5270.25
This is:
• Highest price of the session
• Lowest price of the session
________________________________________
🧠 Why this matters
These are liquidity magnets
Price often:
• Moves toward them
• Sweeps them
• Reverses from them
________________________________________
📉📈 3. Session Lines (On Chart)
🟢 Green dashed line = Session High
🔴 Red dashed line = Session Low
________________________________________
Behavior:
• Lines build during session
• Lines freeze at session end
• New session → reset
________________________________________
🧠 How to use them
🔥 1. Targets
• Long → target session high
• Short → target session low
________________________________________
🔥 2. Reversals
• Price hits session high → look for shorts
• Price hits session low → look for longs
________________________________________
🔥 3. Breakouts
• Strong break above session high → bullish continuation
• Strong break below session low → bearish continuation
________________________________________
🏷 4. Session Labels (New Upgrade)
You now see:
• Session High
• Session Low
👉 Positioned to the right of price (no overlap)
________________________________________
🧠 Why this helps
• Cleaner charts
• No confusion between levels
• Easy to identify key levels instantly
________________________________________
📍 5. Dashboard (Yellow Panel)
Always visible:
• Symbol
• Price
• Change
• Session H/L
• Session time
________________________________________
🧠 Why yellow?
• High visibility
• Doesn’t blend into chart
• Easy to read under pressure
________________________________________
🔥 6. How to Use Everything Together
🟢 Long Setup Example
1. Price near session low
2. You expect bounce
3. Watch panel:
o flashing turns green
4. Enter long
5. Target:
o session high
________________________________________
🔴 Short Setup Example
1. Price near session high
2. You expect rejection
3. Flash turns red
4. Enter short
5. Target:
o session low
________________________________________
⚠️ 7. Important Rules
❌ Don’t use flashing alone
It’s confirmation, not a signal
________________________________________
❌ Don’t ignore session levels
They are key liquidity zones
________________________________________
❌ Don’t chase breakouts blindly
Wait for:
• structure
• confirmation
• momentum
________________________________________
🧠 8. Best Use Cases
🏎 Scalping
• Use flashing + session levels
📊 Intraday trading
• Trade between session high/low
🎯 Targeting
• Use session lines as profit targets
________________________________________
🚀 9. Pro Workflow (Best Way to Use It)
Combine with your Koda BOS indicator
BOS = direction + setup
Price Display = timing + execution
________________________________________
🔥 Example:
1. BOS shows bullish setup
2. Price at session low
3. Flash turns green
4. Enter
5. Target = session high
________________________________________
🧠 Final Summary
This indicator gives you:
• ⚡ Real-time momentum (flashing)
• 💧 Liquidity levels (session high/low)
• 🎯 Targets (session lines)
• 🧭 Context (session structure)
________________________________________
🔑 Core idea:
👉 Trade from session low → session high
👉 Use flashing to time entries
Koda Price Display — Complete How to Use Guide
🎯 What this indicator now does
This iindicator a real-time execution + session context tool.
It shows:
• Live price (with flashing momentum)
• Price change
• Session high & low (live updating)
• Session high/low lines on chart
• Session labels (cleanly offset)
• Movable dashboard
________________________________________
⚡ 1. Flashing Price = Micro Momentum
This is your execution timing tool
🟢 Green Flash
• Price just ticked UP
• Buyers stepping in
🔴 Red Flash
• Price just ticked DOWN
• Sellers stepping in
🟡 Yellow
• Neutral / no recent movement
________________________________________
🧠 How to use it
👉 Use flashing to confirm entries
Example:
• You want to go long
• Wait for green flashes before entering
________________________________________
💧 2. Session High & Low (Core Feature)
What it shows:
Sess H/L: 5285.00 / 5270.25
This is:
• Highest price of the session
• Lowest price of the session
________________________________________
🧠 Why this matters
These are liquidity magnets
Price often:
• Moves toward them
• Sweeps them
• Reverses from them
________________________________________
📉📈 3. Session Lines (On Chart)
🟢 Green dashed line = Session High
🔴 Red dashed line = Session Low
________________________________________
Behavior:
• Lines build during session
• Lines freeze at session end
• New session → reset
________________________________________
🧠 How to use them
🔥 1. Targets
• Long → target session high
• Short → target session low
________________________________________
🔥 2. Reversals
• Price hits session high → look for shorts
• Price hits session low → look for longs
________________________________________
🔥 3. Breakouts
• Strong break above session high → bullish continuation
• Strong break below session low → bearish continuation
________________________________________
🏷 4. Session Labels (New Upgrade)
You now see:
• Session High
• Session Low
👉 Positioned to the right of price (no overlap)
________________________________________
🧠 Why this helps
• Cleaner charts
• No confusion between levels
• Easy to identify key levels instantly
________________________________________
📍 5. Dashboard (Yellow Panel)
Always visible:
• Symbol
• Price
• Change
• Session H/L
• Session time
________________________________________
🧠 Why yellow?
• High visibility
• Doesn’t blend into chart
• Easy to read under pressure
________________________________________
🔥 6. How to Use Everything Together
🟢 Long Setup Example
1. Price near session low
2. You expect bounce
3. Watch panel:
o flashing turns green
4. Enter long
5. Target:
o session high
________________________________________
🔴 Short Setup Example
1. Price near session high
2. You expect rejection
3. Flash turns red
4. Enter short
5. Target:
o session low
________________________________________
⚠️ 7. Important Rules
❌ Don’t use flashing alone
It’s confirmation, not a signal
________________________________________
❌ Don’t ignore session levels
They are key liquidity zones
________________________________________
❌ Don’t chase breakouts blindly
Wait for:
• structure
• confirmation
• momentum
________________________________________
🧠 8. Best Use Cases
🏎 Scalping
• Use flashing + session levels
📊 Intraday trading
• Trade between session high/low
🎯 Targeting
• Use session lines as profit targets
________________________________________
🚀 9. Pro Workflow (Best Way to Use It)
Combine with your Koda BOS indicator
BOS = direction + setup
Price Display = timing + execution
________________________________________
🔥 Example:
1. BOS shows bullish setup
2. Price at session low
3. Flash turns green
4. Enter
5. Target = session high
________________________________________
🧠 Final Summary
This indicator gives you:
• ⚡ Real-time momentum (flashing)
• 💧 Liquidity levels (session high/low)
• 🎯 Targets (session lines)
• 🧭 Context (session structure)
________________________________________
🔑 Core idea:
👉 Trade from session low → session high
👉 Use flashing to time entries
Catatan Rilis
KODA PRICE DISPLAY -Updated verions allows you to choose the siz of the Dashbaord. Koda Price Display — Complete How to Use Guide
What this indicator now does
This indicator a real-time execution + session context tool.
It shows:
• Live price (with flashing momentum)
• Price change
• Session high & low (live updating)
• Session high/low lines on chart
• Session labels (cleanly offset)
• Movable dashboard
________________________________________
1. Flashing Price = Micro Momentum
This is your execution timing tool
Green Flash
• Price just ticked UP
• Buyers stepping in
Red Flash
• Price just ticked DOWN
• Sellers stepping in
Yellow
• Neutral / no recent movement
________________________________________
How to use it
Use flashing to confirm entries
Example:
• You want to go long
• Wait for green flashes before entering
________________________________________
2. Session High & Low (Core Feature)
What it shows:
Sess H/L: 5285.00 / 5270.25
This is:
• Highest price of the session
• Lowest price of the session
________________________________________
Why this matters
These are liquidity magnets
Price often:
• Moves toward them
• Sweeps them
• Reverses from them
________________________________________
3. Session Lines (On Chart)
Green dashed line = Session High
Red dashed line = Session Low
________________________________________
Behavior:
• Lines build during session
• Lines freeze at session end
• New session → reset
________________________________________
How to use them
1. Targets
• Long → target session high
• Short → target session low
________________________________________
2. Reversals
• Price hits session high → look for shorts
• Price hits session low → look for longs
________________________________________
3. Breakouts
• Strong break above session high → bullish continuation
• Strong break below session low → bearish continuation
________________________________________
4. Session Labels (New Upgrade)
You now see:
• Session High
• Session Low
Positioned to the right of price (no overlap)
________________________________________
Why this helps
• Cleaner charts
• No confusion between levels
• Easy to identify key levels instantly
________________________________________
5. Dashboard (Yellow Panel)
Always visible:
• Symbol
• Price
• Change
• Session H/L
• Session time
________________________________________
Why yellow?
• High visibility
• Doesn’t blend into chart
• Easy to read under pressure
________________________________________
6. How to Use Everything Together
Long Setup Example
1. Price near session low
2. You expect bounce
3. Watch panel:
o flashing turns green
4. Enter long
5. Target:
o session high
________________________________________
Short Setup Example
1. Price near session high
2. You expect rejection
3. Flash turns red
4. Enter short
5. Target:
o session low
________________________________________
7. Important Rules
Don’t use flashing alone
It’s confirmation, not a signal
________________________________________
Don’t ignore session levels
They are key liquidity zones
________________________________________
Don’t chase breakouts blindly
Wait for:
• structure
• confirmation
• momentum
________________________________________
8. Best Use Cases
Scalping
• Use flashing + session levels
Intraday trading
• Trade between session high/low
Targeting
• Use session lines as profit targets
________________________________________
9. Pro Workflow (Best Way to Use It)
Combine with your Koda BOS indicator
BOS = direction + setup
Price Display = timing + execution
________________________________________
Example:
1. BOS shows bullish setup
2. Price at session low
3. Flash turns green
4. Enter
5. Target = session high
________________________________________
Final Summary
This indicator gives you:
• Real-time momentum (flashing)
• Liquidity levels (session high/low)
• Targets (session lines)
• Context (session structure)
________________________________________
Core idea:
Trade from session low → session high
Use flashing to time entries
Skrip open-source
Dengan semangat TradingView yang sesungguhnya, pembuat skrip ini telah menjadikannya sebagai sumber terbuka, sehingga para trader dapat meninjau dan memverifikasi fungsinya. Salut untuk penulisnya! Meskipun Anda dapat menggunakannya secara gratis, perlu diingat bahwa penerbitan ulang kode ini tunduk pada Tata Tertib kami.

Pernyataan Penyangkalan
Informasi dan publikasi ini tidak dimaksudkan, dan bukan merupakan, saran atau rekomendasi keuangan, investasi, trading, atau jenis lainnya yang diberikan atau didukung oleh TradingView. Baca selengkapnya di Ketentuan Penggunaan.
Skrip open-source
Dengan semangat TradingView yang sesungguhnya, pembuat skrip ini telah menjadikannya sebagai sumber terbuka, sehingga para trader dapat meninjau dan memverifikasi fungsinya. Salut untuk penulisnya! Meskipun Anda dapat menggunakannya secara gratis, perlu diingat bahwa penerbitan ulang kode ini tunduk pada Tata Tertib kami.
Pernyataan Penyangkalan
Informasi dan publikasi ini tidak dimaksudkan, dan bukan merupakan, saran atau rekomendasi keuangan, investasi, trading, atau jenis lainnya yang diberikan atau didukung oleh TradingView. Baca selengkapnya di Ketentuan Penggunaan.