OPEN-SOURCE SCRIPT
Diupdate OS RSI Envelope
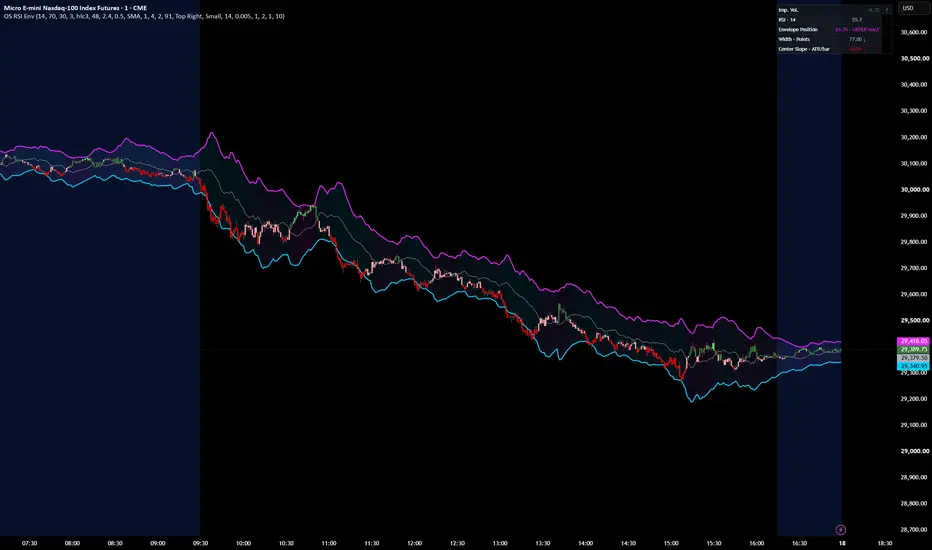
RSI Envelope
The OS RSI Envelope projects dynamic price boundaries where the selected RSI would reach its upper or lower threshold.
With the default 14-period RSI and 70/30 thresholds, the upper boundary represents the price level associated with RSI reaching 70, and the lower boundary represents the level associated with RSI reaching 30.
The boundaries adapt as recent upward and downward price movement changes.
Light smoothing can make them easier to read.
This is a price overlay, not a traditional volatility band.
Its boundaries provide context for where price sits relative to RSI pressure levels; they do not predict reversals or guarantee that price will turn.
How to interpret it
- Between the boundaries: Price is inside the envelope. Its dashboard position shows where it sits: 0% at the lower boundary, 50% at the center, and 100% at the upper boundary.
- Below 0% or above 100%: Price is outside the envelope. This marks movement beyond the projected RSI threshold level; it is not, by itself, a reversal signal.
- Envelope width: The distance between the upper and lower boundaries in price points. Widening means that distance is increasing; narrowing means it is decreasing.
- Center slope: The envelope midpoint’s one-bar change divided by ATR. The arrow and color show whether the midpoint is rising, falling, or relatively flat.
In a strong trend, price can stay near or beyond a boundary. Read the envelope alongside price action and other context; don’t treat a boundary touch alone as a buy or sell signal.
Catatan Rilis
Updated Impulse Volume CandlesImpulse Volume calculations and candle-color logic adapted from [Impulse Volume Oscillator by AlphaExtract](tradingview.com/script/toO8ErhY-Impulse-Volume-Oscillator-Alpha-Extract/). Licensed under the Mozilla Public License 2.0. Integrated and modified for OS Market Compass.
Skrip open-source
Dengan semangat TradingView yang sesungguhnya, pembuat skrip ini telah menjadikannya sebagai sumber terbuka, sehingga para trader dapat meninjau dan memverifikasi fungsinya. Salut untuk penulisnya! Meskipun Anda dapat menggunakannya secara gratis, perlu diingat bahwa penerbitan ulang kode ini tunduk pada Tata Tertib kami.

Pernyataan Penyangkalan
Informasi dan publikasi ini tidak dimaksudkan, dan bukan merupakan, saran atau rekomendasi keuangan, investasi, trading, atau jenis lainnya yang diberikan atau didukung oleh TradingView. Baca selengkapnya di Ketentuan Penggunaan.
Skrip open-source
Dengan semangat TradingView yang sesungguhnya, pembuat skrip ini telah menjadikannya sebagai sumber terbuka, sehingga para trader dapat meninjau dan memverifikasi fungsinya. Salut untuk penulisnya! Meskipun Anda dapat menggunakannya secara gratis, perlu diingat bahwa penerbitan ulang kode ini tunduk pada Tata Tertib kami.
Pernyataan Penyangkalan
Informasi dan publikasi ini tidak dimaksudkan, dan bukan merupakan, saran atau rekomendasi keuangan, investasi, trading, atau jenis lainnya yang diberikan atau didukung oleh TradingView. Baca selengkapnya di Ketentuan Penggunaan.