Kalman Scalper
---
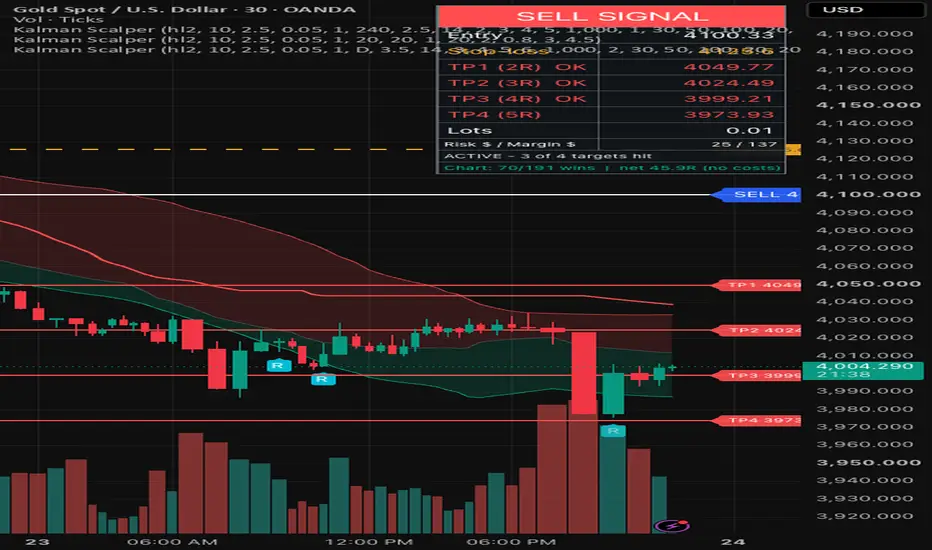
**Kalman Scalper – Trend Signals with Entry, Stop-Loss and 4 Targets**
**OVERVIEW**
Kalman Scalper is a trend-following indicator for intraday charts. It finds Supertrend flips, filters them with a higher-timeframe trend, and then draws a complete trade plan on the chart: entry, stop-loss and four profit targets, with a position-size suggestion in a corner box. It was developed and tested on XAUUSD (gold) on the 30-minute chart, and the default settings are tuned for that. It is an analysis tool, not a trading system you can run on autopilot.
**HOW IT WORKS**
1. **Kalman-filtered Supertrend.** Price (HL2) and ATR are each smoothed with a simple one-dimensional Kalman filter before the Supertrend bands are built. The aim is to reduce noise in the bands. In my tests, a plain Supertrend performed about the same, so the filter can be switched off in the settings.
2. **Higher-timeframe filter.** A signal is only valid if it agrees with the direction of the same Supertrend on a higher timeframe (Daily by default, 4h as an alternative). The filter uses the last completed higher-timeframe bar, so it does not repaint and does not look ahead. This filter was the single most useful part of the logic in testing.
3. **Trade plan.** When a valid signal appears, the script plots:
- Entry at the signal candle's close (white line)
- Stop-loss at a multiple of ATR(14) (amber line)
- Four targets at R-multiples of the stop distance: TP1 to TP4 (green lines for buys, red lines for sells)
25% of the position is assumed closed at each target. If the stop is hit, or the Supertrend flips against the trade, the trade is closed and the result is labelled in R. Only the latest trade's levels are drawn by default to keep the chart clean.
4. **Corner box.** Shows the live signal (BUY / SELL / closed), entry, stop-loss, TP1–TP4 with a mark when each is hit, suggested lot size, dollar risk, margin used, trade status, and a running win/loss and net-R tally for the trades visible on the chart.
5. **Position sizing helper.** Lot size is calculated from your account balance, risk per trade (%), the stop distance, your leverage and the contract size (default: 100 oz per lot for XAUUSD CFDs). Margin use is capped. Check the contract size and minimum lot with your own broker.
6. **Optional extras (off by default).** VWMA overbought/oversold bands, "R" reversal labels, and absorption bubbles (heavy volume with a small range). I tested them and found no reliable edge, so they are provided only as visual context.
**HOW TO USE**
- Add it to a 30-minute XAUUSD chart (it can be applied to other symbols and timeframes, but the defaults were not tuned for them).
- Wait for a BUY triangle and the corner box to show a signal. The chart shows where the entry, stop and targets would be.
- Alerts: create an alert on this indicator and choose "Any alert() function call". Messages include the entry, stop and all four targets, each target hit, and the trade close.
- Set your account balance, risk %, leverage and contract size under "Trade plan".
**DEFAULT SETTINGS (from my testing on XAUUSD 30m)**
- Supertrend: ATR length 10, multiplier 2.5, Kalman filter on
- Higher-timeframe filter: Daily
- Direction: long (BUY) only
- Stop-loss: 3.5 × ATR(14)
- Targets: 3R / 4R / 5R / 6R, 25% closed at each
- Risk: 2% per trade, leverage 1:30, margin cap 50%
**BACKTEST NOTES (please read)**
I tested the rules on about 3 years of XAUUSD 1-minute data (Oct 2023 – Oct 2026, Dukascopy bid prices, resampled to 30 minutes). Entries were at the next bar's open, with spread, slippage and overnight swap costs included at estimated values.
- Long-only, default settings: about 231 trades, profit factor about 1.9, win rate about 45%, maximum drawdown about 10R before position sizing.
- Shorts were not profitable in the same test, which is why long-only is the default. The edge came from gold's strong uptrend over this period. If gold enters a prolonged downtrend, results are likely to be much worse.
- The settings were chosen from a sweep of several hundred combinations on the same data, so the results are optimistic (in-sample). I checked that most combinations were profitable in both halves of the data, but this does not guarantee future performance.
- Most trades are small losers; a minority of large trend trades produce the profit. Expect long losing streaks.
- These results come from my own Python simulation, not from TradingView's Strategy Tester. On-chart "Net R" ignores trading costs.
**LIMITATIONS**
- Signals are generated at the bar close. In live trading, fills will differ from the plotted entry, especially in fast markets.
- Past results do not predict future results. Real conditions (spreads, swaps, slippage, margin rules) vary by broker.
- Position-size output is a calculation aid and not advice. Minimum lot sizes can force you to risk more than your chosen percentage on small accounts.
- Higher-timeframe values use the last completed bar. Session definitions for the Daily bar differ between data feeds, which can slightly change signals.
**ORIGINALITY**
The script is original code. It combines a Kalman-filtered Supertrend, a non-repainting higher-timeframe trend filter, a four-target trade plan with partial exits, and a risk-based position-size helper. The Kalman-plus-Supertrend idea is a publicly discussed concept; the filter, the trade-management logic and all testing here are my own implementation.
**DISCLAIMER**
This indicator is for educational and informational purposes only and is not financial advice. Trading leveraged products such as CFDs carries a high risk of loss, and you can lose more than you deposit. Test on a demo account first and never risk money you cannot afford to lose.
---
**Before you publish**
- **Compile first.** The script has never been compiled in TradingView, and publishing something that errors is a bad look. Paste it into the Pine Editor, fix anything it reports (send me the message and I'll help), and check the signals look sensible on a 30m XAUUSD chart.
- **Title and category.** Use a plain title like "Kalman Scalper – Trend Signals with Trade Plan", and publish it as open-source if you want the broadest audience.
- **Screenshots.** Add a clean chart screenshot showing one BUY signal with its entry, stop and targets.
- **Credit.** If you drew on someone else's published script, mention them in the description.
- **Wording to keep.** Don't remove the backtest caveats or the disclaimer, because TradingView moderators look for them.

Pernyataan Penyangkalan
Informasi dan publikasi ini tidak dimaksudkan, dan bukan merupakan, saran atau rekomendasi keuangan, investasi, trading, atau jenis lainnya yang diberikan atau didukung oleh TradingView. Baca selengkapnya di Ketentuan Penggunaan.
Pernyataan Penyangkalan
Informasi dan publikasi ini tidak dimaksudkan, dan bukan merupakan, saran atau rekomendasi keuangan, investasi, trading, atau jenis lainnya yang diberikan atau didukung oleh TradingView. Baca selengkapnya di Ketentuan Penggunaan.