OPEN-SOURCE SCRIPT
Diupdate ATR + STRAT Dashboard (LAST + DIR + REV) + Est Moves
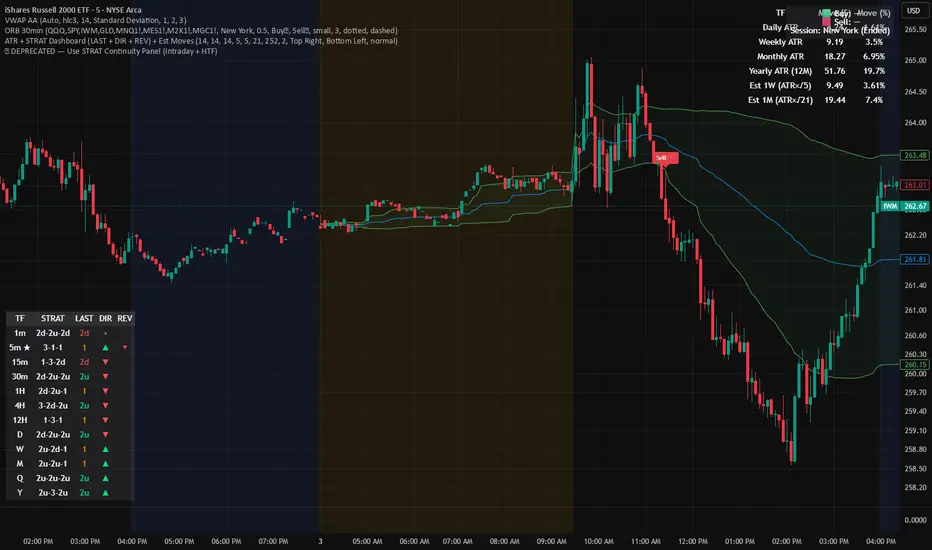
ATR + STRAT Dashboard is a multi-timeframe market structure indicator built around The Strat and ATR context. It summarizes higher-timeframe control (buyers vs sellers), highlights key Strat conditions (inside/outside/2-1-2 style transitions), and flags common reversal candles (hammer / shooting star style signals) to help spot potential turns. It also includes ATR-based context and estimated move guidance so you can quickly gauge whether price has “room” to run or is extended.
What it shows
MTF Dashboard: quick read of trend/control across multiple timeframes
Direction/Control: color-based bias (buyers vs sellers in charge)
Reversal Flags: highlights reversal-style candles for awareness (not guaranteed)
ATR Context + Estimated Moves: volatility-based framework for targets/expectations
Non-repainting HTF behavior: designed to use closed higher-timeframe bars to reduce repaint surprises
Note: This tool is for structure + context, not trade signals by itself. Always confirm with your plan/risk management.
What it shows
MTF Dashboard: quick read of trend/control across multiple timeframes
Direction/Control: color-based bias (buyers vs sellers in charge)
Reversal Flags: highlights reversal-style candles for awareness (not guaranteed)
ATR Context + Estimated Moves: volatility-based framework for targets/expectations
Non-repainting HTF behavior: designed to use closed higher-timeframe bars to reduce repaint surprises
Note: This tool is for structure + context, not trade signals by itself. Always confirm with your plan/risk management.
Catatan Rilis
⚠️ Deprecated / DiscontinuedThis script is no longer supported. It can show inconsistent multi-timeframe STRAT values depending on chart timeframe/session mapping.
Use the replacements:
STRAT Continuity Panel — Intraday (Extended) (≤4H charts)
STRAT Continuity Panel — HTF (D/W/M/Q/Y) (Daily/Weekly/Monthly)
Skrip open-source
Dengan semangat TradingView yang sesungguhnya, pembuat skrip ini telah menjadikannya sebagai sumber terbuka, sehingga para trader dapat meninjau dan memverifikasi fungsinya. Salut untuk penulisnya! Meskipun Anda dapat menggunakannya secara gratis, perlu diingat bahwa penerbitan ulang kode ini tunduk pada Tata Tertib kami.

Trade smarter, not harder 📡 Strat Radar does the heavy lifting — scanning 50 tickers so you can find setups fast. Try it for free 👉 whop.com/joined/strat-radar
Pernyataan Penyangkalan
Informasi dan publikasi ini tidak dimaksudkan, dan bukan merupakan, saran atau rekomendasi keuangan, investasi, trading, atau jenis lainnya yang diberikan atau didukung oleh TradingView. Baca selengkapnya di Ketentuan Penggunaan.
Skrip open-source
Dengan semangat TradingView yang sesungguhnya, pembuat skrip ini telah menjadikannya sebagai sumber terbuka, sehingga para trader dapat meninjau dan memverifikasi fungsinya. Salut untuk penulisnya! Meskipun Anda dapat menggunakannya secara gratis, perlu diingat bahwa penerbitan ulang kode ini tunduk pada Tata Tertib kami.
Trade smarter, not harder 📡 Strat Radar does the heavy lifting — scanning 50 tickers so you can find setups fast. Try it for free 👉 whop.com/joined/strat-radar
Pernyataan Penyangkalan
Informasi dan publikasi ini tidak dimaksudkan, dan bukan merupakan, saran atau rekomendasi keuangan, investasi, trading, atau jenis lainnya yang diberikan atau didukung oleh TradingView. Baca selengkapnya di Ketentuan Penggunaan.