Delta Flow Candles [JOAT]
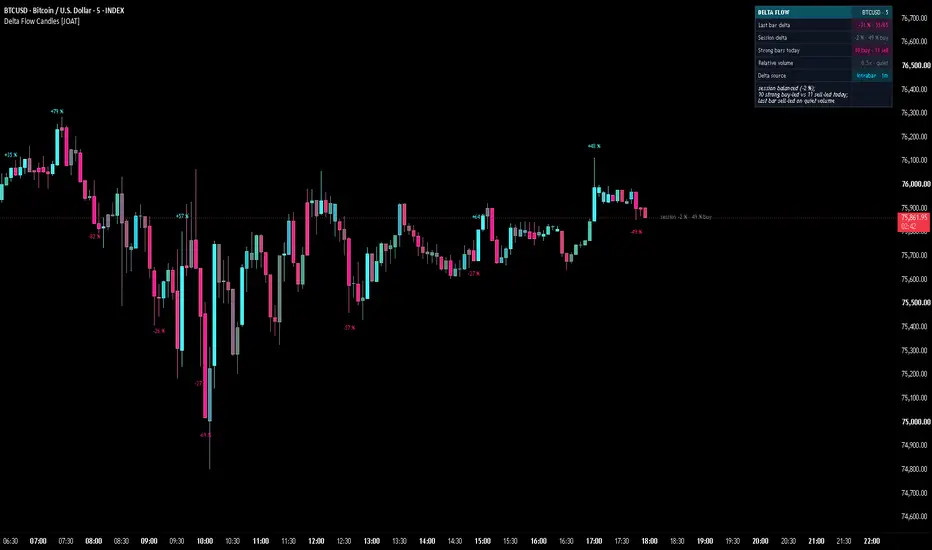
Delta Flow Candles is an open-source candle recolouring tool that shows who controlled each bar. Bright cyan when buying dominated, hot pink when selling did, muted grey when it was a wash, and the delta percentage written on the bars that mattered.
Every bar gets a delta score between -100 % (all of its volume credited to sellers) and +100 % (all of it credited to buyers). The score runs through a colour gradient, and the candle's saturation also follows its relative volume, so quiet bars fade toward grey and the heavy bars stand out on their own. Wicks and borders are drawn a shade brighter than the body for a crisp outline. The few bars where one side was clearly in control on real participation get a short tag such as "+62 %", and a small dashboard sums up the session.
Important: hide TradingView's own candles
This indicator draws its own candles on top of the chart. To see only the recoloured candles, open Chart settings > Symbol and untick Body, Borders and Wick (or set those colours fully transparent). If the chart's own candles stay visible, both sets are drawn on top of each other and the colours mix. Set "Candle mode" to Off at any time to keep only the tags and the dashboard.
Core Concepts
1. The delta score
By default the split comes from the chart bar itself, with no extra data request. The share of the bar's volume credited to buyers is where the close sits in the high-low range, blended with the body direction:
Pine Script®
A close on the high of a green bar credits nearly all of its volume to buyers; a close in the middle of a doji credits half to each side.
2. Optional intrabar delta
With "Intrabar delta (1m)" turned on, the script makes one lower-timeframe request and splits each intrabar with the same rule, then sums the parts. The lower timeframe is picked automatically and never goes below 1 minute, because free accounts have no seconds data: 1m on charts below 1H, 5m on 1H to 4H, 15m on 4H to daily, 30m on daily, 4H on weekly and above. Bars with no intrabar data (older history, a 1m chart, symbols without volume) fall back to the chart proxy, and the dashboard says which source the newest bar used.
3. The colour gradient
The strength of a bar is its |delta| divided by the "full colour" value. Below about 12 % of it the candle stays grey, at three quarters of it the candle reaches the theme's bull or bear colour, and at full strength it reaches the brightest bull or hottest bear tone. In Delta mode a second gradient follows relative volume: at or above the "full colour at" multiple the colour is full, and below it the candle blends toward a soft grey (completely at 0.25x the average volume). On a white chart, "stronger" means deeper rather than lighter so the candles stay readable.
4. Strong bars and their tags
A strong bar is a closed bar whose |delta| AND relative volume both pass their inputs. It gets a short tag above the wick when buying led or below it when selling led, written in the side's colour, for example "+62 %". Hover a tag for the buy and sell share, the relative volume, the volume and the source. When a nearby tag already holds the slot, the new tag moves further away from price, never on top of the earlier one. Only the newest tags are kept (12 by default), so history does not litter the chart.
5. The session numbers
The session delta sums buy minus sell volume since the trading day started, as a share of all the volume traded in it. Daily charts use the week, weekly charts the month, monthly charts the year. The same number is written on a tag just right of the last bar and in the dashboard.
Features
Input Parameters
Delta candles:
Delta tags:
Theme:
Limits (free account):
Dashboard:
How to Use This Indicator
Reading the candles
Bright bull-coloured candles are bars where buyers took most of the volume; hot bear-coloured candles are bars where sellers did. Grey candles are balanced bars or bars traded on little volume. A run of bright candles describes one side keeping control; a strong colour on a small-range bar, or a bar whose colour disagrees with its direction of travel, is what order-flow readers call absorption.
Reading the tags
The tags mark only the bars where one side was clearly in control on heavy volume. The number is the bar's delta: +62 % means buyers took 81 % of its volume and sellers 19 %. Several tags of the same side close together describe sustained pressure; tags of both sides in the same area describe a contested level.
Reading the dashboard
The Session delta row and the tag at the right edge tell which side controlled the volume of the day so far. The strong-bar counts say how much of that came from decisive bars. The Read line sums it up in one sentence. Hover any row for what it measures.
Alerts
Set alerts to "Once per bar close": a strong bar is only known when the bar has closed.
Indicator Limitations
Originality Statement
Disclaimer
This indicator is provided for educational and informational purposes only. It is not financial advice and it does not give buy or sell signals. Trading involves substantial risk of loss. The delta shown is an estimate built from bar data and describes what already happened inside each bar; it does not predict future price behaviour. The author accepts no responsibility for trading losses resulting from use of this indicator.
Made with passion by jackofalltrades
Every bar gets a delta score between -100 % (all of its volume credited to sellers) and +100 % (all of it credited to buyers). The score runs through a colour gradient, and the candle's saturation also follows its relative volume, so quiet bars fade toward grey and the heavy bars stand out on their own. Wicks and borders are drawn a shade brighter than the body for a crisp outline. The few bars where one side was clearly in control on real participation get a short tag such as "+62 %", and a small dashboard sums up the session.
Important: hide TradingView's own candles
This indicator draws its own candles on top of the chart. To see only the recoloured candles, open Chart settings > Symbol and untick Body, Borders and Wick (or set those colours fully transparent). If the chart's own candles stay visible, both sets are drawn on top of each other and the colours mix. Set "Candle mode" to Off at any time to keep only the tags and the dashboard.
Core Concepts
1. The delta score
By default the split comes from the chart bar itself, with no extra data request. The share of the bar's volume credited to buyers is where the close sits in the high-low range, blended with the body direction:
A close on the high of a green bar credits nearly all of its volume to buyers; a close in the middle of a doji credits half to each side.
2. Optional intrabar delta
With "Intrabar delta (1m)" turned on, the script makes one lower-timeframe request and splits each intrabar with the same rule, then sums the parts. The lower timeframe is picked automatically and never goes below 1 minute, because free accounts have no seconds data: 1m on charts below 1H, 5m on 1H to 4H, 15m on 4H to daily, 30m on daily, 4H on weekly and above. Bars with no intrabar data (older history, a 1m chart, symbols without volume) fall back to the chart proxy, and the dashboard says which source the newest bar used.
3. The colour gradient
The strength of a bar is its |delta| divided by the "full colour" value. Below about 12 % of it the candle stays grey, at three quarters of it the candle reaches the theme's bull or bear colour, and at full strength it reaches the brightest bull or hottest bear tone. In Delta mode a second gradient follows relative volume: at or above the "full colour at" multiple the colour is full, and below it the candle blends toward a soft grey (completely at 0.25x the average volume). On a white chart, "stronger" means deeper rather than lighter so the candles stay readable.
4. Strong bars and their tags
A strong bar is a closed bar whose |delta| AND relative volume both pass their inputs. It gets a short tag above the wick when buying led or below it when selling led, written in the side's colour, for example "+62 %". Hover a tag for the buy and sell share, the relative volume, the volume and the source. When a nearby tag already holds the slot, the new tag moves further away from price, never on top of the earlier one. Only the newest tags are kept (12 by default), so history does not litter the chart.
5. The session numbers
The session delta sums buy minus sell volume since the trading day started, as a share of all the volume traded in it. Daily charts use the week, weekly charts the month, monthly charts the year. The same number is written on a tag just right of the last bar and in the dashboard.
Features
- Delta candles: body, wick and border recoloured by a -100 % to +100 % delta score through a grey > theme colour > peak colour gradient, wick and border a shade brighter
- Quiet-bar fade: saturation scaled by relative volume, so low-participation bars recede and heavy bars stand out
- Volume mode: the candle's own direction in the bull / bear colour with brightness set by relative volume only
- Two delta sources: chart-bar proxy by default (no request calls), optional intrabar split from 1-minute or higher bars
- Delta % tags: short tags on strong closed bars only, de-collided, newest 12 kept, details in the tooltip
- Session tag: the session's delta and buy share right of the last bar
- Dashboard: Last bar delta, Session delta, Strong bars today, Relative volume, Delta source and a Read line, every row with a tooltip explaining how order-flow readers use it; compact mode for phones
- Themes: Delta Cyan / Pink (default), JOAT Signature, Midnight Blue / Red, Aurora Night, Paper & Ink (black / white, selling-led candles drawn hollow), Lime Ember and Custom; automatic light / dark chart handling
- Alerts: strong buy-led bar, strong sell-led bar (events, not signals)
- Built for free accounts: no request calls by default, never below 1 minute when the intrabar option is on, labels capped and retired oldest-first, nothing anchored beyond the 5,000-bar history
Input Parameters
Delta candles:
- Candle mode: Delta, Volume or Off (default: Delta)
- Intrabar delta (1m) (default: off)
- Close-position weight: 0.0 = body direction only, 1.0 = close position only (default: 0.7)
- Full colour at |delta| % (proxy / intrabar) (default: 70 / 35)
- Volume average length (default: 20)
- Fade quiet bars / full colour at (x avg volume) (default: on, 1.0)
- Volume mode: full colour at (x avg volume) (default: 2.0)
Delta tags:
- Delta % tags on strong bars / size: Small, Normal or Large (default: on, Small)
- Strong bar: |delta| % at least (proxy / intrabar) (default: 50 / 25)
- Strong bar: relative volume at least (default: 1.8)
- Tag spacing (ATR) (default: 0.6; the script also keeps at least 1/38 of the recent price span)
- Session delta tag at the right edge (default: on)
Theme:
- Theme (default: Delta Cyan / Pink), Brightness 1-5 (default: 3), Chart background Auto / Dark / Light
- Custom bull / bear, accent / neutral, text / panel and glow colours (used by the Custom theme)
Limits (free account):
- Max delta tags kept (default: 12)
Dashboard:
- Show dashboard, Dashboard position (default: Top Right), Dashboard size (default: Small), Compact dashboard, Tinted value cells
How to Use This Indicator
Reading the candles
Bright bull-coloured candles are bars where buyers took most of the volume; hot bear-coloured candles are bars where sellers did. Grey candles are balanced bars or bars traded on little volume. A run of bright candles describes one side keeping control; a strong colour on a small-range bar, or a bar whose colour disagrees with its direction of travel, is what order-flow readers call absorption.
Reading the tags
The tags mark only the bars where one side was clearly in control on heavy volume. The number is the bar's delta: +62 % means buyers took 81 % of its volume and sellers 19 %. Several tags of the same side close together describe sustained pressure; tags of both sides in the same area describe a contested level.
Reading the dashboard
The Session delta row and the tag at the right edge tell which side controlled the volume of the day so far. The strong-bar counts say how much of that came from decisive bars. The Read line sums it up in one sentence. Hover any row for what it measures.
Alerts
Set alerts to "Once per bar close": a strong bar is only known when the bar has closed.
Indicator Limitations
- The default delta is a proxy estimated from each bar's open, high, low, close and volume, not from real bid / ask trades; it describes where the bar closed within its range, weighted by volume
- The intrabar option is also an estimate: each 1-minute (or higher) bar is split by the same rule, which is finer but still not true tick-level order flow
- Intrabar data does not reach as far back as the chart's history on a free account; older bars fall back to the proxy, and on a 1m chart there is nothing finer to split, so the proxy is used
- Symbols without volume (many forex pairs and indices) still get a delta colour from the close position, but no relative volume, no quiet-bar fade, no strong bars and no tags
- Tags and the strong-bar counts use closed bars only. The newest candle's colour, the Last bar row and the session numbers follow the live bar and settle when it closes
- Relative volume and ATR(14) are computed on the chart timeframe, so the same market reads differently on 1m and 1H
- TradingView's own candles must be hidden (Chart settings > Symbol) for the colours to show cleanly
Originality Statement
- Two independent gradients shape every candle: the delta score sets the hue and its strength, and relative volume sets the saturation, so a strong delta on quiet volume never looks like a strong delta on heavy volume
- Delta percentages are written only on the bars where delta and participation were both decisive, de-collided and capped, instead of on every bar
- One script covers the free-account case end to end: a no-request proxy by default, an optional intrabar split that is never asked for seconds data, and a dashboard that names which source the newest bar used
Disclaimer
This indicator is provided for educational and informational purposes only. It is not financial advice and it does not give buy or sell signals. Trading involves substantial risk of loss. The delta shown is an estimate built from bar data and describes what already happened inside each bar; it does not predict future price behaviour. The author accepts no responsibility for trading losses resulting from use of this indicator.
Made with passion by jackofalltrades

The Proven Highest Win Rate Trading Indicators, Strategies, Tools, + Signals !! 🃏
Get Access and See Full Results👇
jackofalltrades.vip 🌐
Get Access and See Full Results👇
jackofalltrades.vip 🌐
Pernyataan Penyangkalan
Informasi dan publikasi ini tidak dimaksudkan, dan bukan merupakan, saran atau rekomendasi keuangan, investasi, trading, atau jenis lainnya yang diberikan atau didukung oleh TradingView. Baca selengkapnya di Ketentuan Penggunaan.
The Proven Highest Win Rate Trading Indicators, Strategies, Tools, + Signals !! 🃏
Get Access and See Full Results👇
jackofalltrades.vip 🌐
Get Access and See Full Results👇
jackofalltrades.vip 🌐
Pernyataan Penyangkalan
Informasi dan publikasi ini tidak dimaksudkan, dan bukan merupakan, saran atau rekomendasi keuangan, investasi, trading, atau jenis lainnya yang diberikan atau didukung oleh TradingView. Baca selengkapnya di Ketentuan Penggunaan.