OPEN-SOURCE SCRIPT
SHM - RSI Momentum Matrix
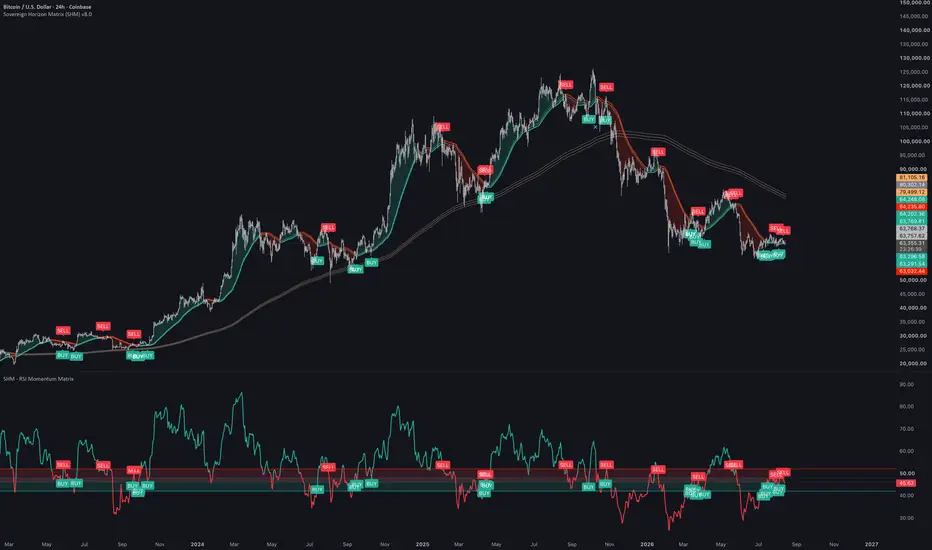
SHM - RSI Momentum Matrix (Pine Script v6)
Executive Overview
The SHM - RSI Momentum Matrix is a quantitative, sub-pane momentum filter engineered for high-probability trend-following strategies. Acting as the dedicated momentum gate for the Sovereign Horizon Matrix (SHM) v8.0 ecosystem, this indicator isolates high-velocity structural breaks while strictly filtering out late, momentum-exhausted entries.
Rather than using standard, single-timeframe momentum oscillators that chop during consolidation, the Matrix utilizes a Timeframe-Locked RSI Engine paired with dual Weighted Moving Averages (WMAs) and a macro structural trend filter.
Core Architectural Pillars: How It Works
1. Timeframe-Locked RSI Momentum Engine
* Non-Repainting Security Calculations: Uses request.security() with offset closed bars (rsi_raw[1]) to eliminate repainting.
* Higher-Timeframe Alignment: By default, the RSI calculation is locked to a 24-hour (1440) rolling evaluation window regardless of the chart timeframe you are viewing.
* Narrow Velocity Gates & Exhaustion Caps:
* Long Entry Gate (42.0 – 48.0 RSI): Captures bullish acceleration before price becomes overbought. If RSI exceeds 48.0, the system flags the move as overextended and blocks the signal.
* Short Entry Gate (46.0 – 52.0 RSI): Captures bearish distribution before price reaches oversold levels.
2. Dual WMA Structural Framework
* Fast Institutional WMA (63): Tracks immediate directional momentum shifts.
* Macro Baseline WMA (480): Acts as the primary macro structural trend floor/ceiling.
* Sensitivity Filter (41 SMA): Ensures price is trading on the correct side of short-term structure before validating a setup.
3. Macro Tide Filter
Requires price action to align with the macro 480 WMA trend direction (Price > 480 WMA for Longs; Price < 480 WMA for Shorts), ensuring you never trade against primary market tide.
4. Experimental Baseline Price Action Module
Offers customizable baseline geometry execution mode:
* Candle Body Trigger: Requires a confirmed candle Close cross over the 63 or 480 WMAs.
* Candle Wick Trigger: Captures intraday High/Low wick breaches across WMA lines for faster sensitivity.
Joint Visual Connection with SHM 8.0
When paired with the main SHM 8.0 Overlay Strategy, this indicator pane serves as the visual "truth engine" that explains why a trade signal is allowed or rejected on the main price chart.
+-------------------------------------------------------------------------+
| MAIN CHART (SHM 8.0 Strategy Overlay) |
| - Price crosses 63/480 WMA baseline |
| - Displays BUY/SELL strategy execution labels |
+-------------------------------------------------------------------------+
|
v (Synchronized Confirmation)
+-------------------------------------------------------------------------+
| SUB-PANE (SHM - RSI Momentum Matrix) |
| - RSI Wave enters shaded Velocity Zone (Teal = Long / Red = Short) |
| - Prints matching BUY/SELL label directly on the Locked RSI Line |
+-------------------------------------------------------------------------+
1. Synchronized Signal Labels: When a valid entry condition triggers on the main chart, an identical BUY or SELL label prints at the exact same candle inside the RSI Momentum Matrix sub-pane.
2. Shaded Entry Threshold Zones:
* Teal Zone: Visualizes the 42.0 – 48.0 Long momentum window.
* Red Zone: Visualizes the 46.0 – 52.0 Short momentum window.
Note- Make sure that both scripts have the same numbers to receive proper signal.
3. Instant Rejection Audit: If you see a WMA line cross on the main price chart without a corresponding BUY/SELL label in the RSI sub-pane, the sub-pane visually demonstrates that RSI was outside the shaded velocity zone—protecting capital from false breakouts.
Key Parameter Settings Guide
Input Group Parameter Recommended Default Description
1. Core Framework Fast WMA / Slow WMA 63 / 480 Structural trend baselines.
Structural Sensitivity 41 Short-term trend confirmation filter.
2. Macro Tide Enable Macro Tide True Forces alignment with the 480 WMA trend.
3. RSI Matrix Locked Timeframe 1440 (Daily) Locks RSI to HTF calculation.
Lookback Period 33 RSI calculation length.
Long Min / Max 42.0 / 48.0 Bullish momentum velocity window.
Short Max / Min 52.0 / 46.0 Bearish momentum velocity window.
Best Practices for Trading
* Timeframe Flexibility: Best utilized on Daily (24h) or 4H charts for crypto, index futures (SPY/NQ), and FX macro trend trading.
* Bar Close Confirmation: Always wait for the active candle to close to ensure full RSI higher-timeframe data synchronization.
Executive Overview
The SHM - RSI Momentum Matrix is a quantitative, sub-pane momentum filter engineered for high-probability trend-following strategies. Acting as the dedicated momentum gate for the Sovereign Horizon Matrix (SHM) v8.0 ecosystem, this indicator isolates high-velocity structural breaks while strictly filtering out late, momentum-exhausted entries.
Rather than using standard, single-timeframe momentum oscillators that chop during consolidation, the Matrix utilizes a Timeframe-Locked RSI Engine paired with dual Weighted Moving Averages (WMAs) and a macro structural trend filter.
Core Architectural Pillars: How It Works
1. Timeframe-Locked RSI Momentum Engine
* Non-Repainting Security Calculations: Uses request.security() with offset closed bars (rsi_raw[1]) to eliminate repainting.
* Higher-Timeframe Alignment: By default, the RSI calculation is locked to a 24-hour (1440) rolling evaluation window regardless of the chart timeframe you are viewing.
* Narrow Velocity Gates & Exhaustion Caps:
* Long Entry Gate (42.0 – 48.0 RSI): Captures bullish acceleration before price becomes overbought. If RSI exceeds 48.0, the system flags the move as overextended and blocks the signal.
* Short Entry Gate (46.0 – 52.0 RSI): Captures bearish distribution before price reaches oversold levels.
2. Dual WMA Structural Framework
* Fast Institutional WMA (63): Tracks immediate directional momentum shifts.
* Macro Baseline WMA (480): Acts as the primary macro structural trend floor/ceiling.
* Sensitivity Filter (41 SMA): Ensures price is trading on the correct side of short-term structure before validating a setup.
3. Macro Tide Filter
Requires price action to align with the macro 480 WMA trend direction (Price > 480 WMA for Longs; Price < 480 WMA for Shorts), ensuring you never trade against primary market tide.
4. Experimental Baseline Price Action Module
Offers customizable baseline geometry execution mode:
* Candle Body Trigger: Requires a confirmed candle Close cross over the 63 or 480 WMAs.
* Candle Wick Trigger: Captures intraday High/Low wick breaches across WMA lines for faster sensitivity.
Joint Visual Connection with SHM 8.0
When paired with the main SHM 8.0 Overlay Strategy, this indicator pane serves as the visual "truth engine" that explains why a trade signal is allowed or rejected on the main price chart.
+-------------------------------------------------------------------------+
| MAIN CHART (SHM 8.0 Strategy Overlay) |
| - Price crosses 63/480 WMA baseline |
| - Displays BUY/SELL strategy execution labels |
+-------------------------------------------------------------------------+
|
v (Synchronized Confirmation)
+-------------------------------------------------------------------------+
| SUB-PANE (SHM - RSI Momentum Matrix) |
| - RSI Wave enters shaded Velocity Zone (Teal = Long / Red = Short) |
| - Prints matching BUY/SELL label directly on the Locked RSI Line |
+-------------------------------------------------------------------------+
1. Synchronized Signal Labels: When a valid entry condition triggers on the main chart, an identical BUY or SELL label prints at the exact same candle inside the RSI Momentum Matrix sub-pane.
2. Shaded Entry Threshold Zones:
* Teal Zone: Visualizes the 42.0 – 48.0 Long momentum window.
* Red Zone: Visualizes the 46.0 – 52.0 Short momentum window.
Note- Make sure that both scripts have the same numbers to receive proper signal.
3. Instant Rejection Audit: If you see a WMA line cross on the main price chart without a corresponding BUY/SELL label in the RSI sub-pane, the sub-pane visually demonstrates that RSI was outside the shaded velocity zone—protecting capital from false breakouts.
Key Parameter Settings Guide
Input Group Parameter Recommended Default Description
1. Core Framework Fast WMA / Slow WMA 63 / 480 Structural trend baselines.
Structural Sensitivity 41 Short-term trend confirmation filter.
2. Macro Tide Enable Macro Tide True Forces alignment with the 480 WMA trend.
3. RSI Matrix Locked Timeframe 1440 (Daily) Locks RSI to HTF calculation.
Lookback Period 33 RSI calculation length.
Long Min / Max 42.0 / 48.0 Bullish momentum velocity window.
Short Max / Min 52.0 / 46.0 Bearish momentum velocity window.
Best Practices for Trading
* Timeframe Flexibility: Best utilized on Daily (24h) or 4H charts for crypto, index futures (SPY/NQ), and FX macro trend trading.
* Bar Close Confirmation: Always wait for the active candle to close to ensure full RSI higher-timeframe data synchronization.
Skrip open-source
Dengan semangat TradingView yang sesungguhnya, pembuat skrip ini telah menjadikannya sebagai sumber terbuka, sehingga para trader dapat meninjau dan memverifikasi fungsinya. Salut untuk penulisnya! Meskipun Anda dapat menggunakannya secara gratis, perlu diingat bahwa penerbitan ulang kode ini tunduk pada Tata Tertib kami.

Pernyataan Penyangkalan
Informasi dan publikasi ini tidak dimaksudkan, dan bukan merupakan, saran atau rekomendasi keuangan, investasi, trading, atau jenis lainnya yang diberikan atau didukung oleh TradingView. Baca selengkapnya di Ketentuan Penggunaan.
Skrip open-source
Dengan semangat TradingView yang sesungguhnya, pembuat skrip ini telah menjadikannya sebagai sumber terbuka, sehingga para trader dapat meninjau dan memverifikasi fungsinya. Salut untuk penulisnya! Meskipun Anda dapat menggunakannya secara gratis, perlu diingat bahwa penerbitan ulang kode ini tunduk pada Tata Tertib kami.
Pernyataan Penyangkalan
Informasi dan publikasi ini tidak dimaksudkan, dan bukan merupakan, saran atau rekomendasi keuangan, investasi, trading, atau jenis lainnya yang diberikan atau didukung oleh TradingView. Baca selengkapnya di Ketentuan Penggunaan.