Diupdate
BarrettFVG HTF Pivot Reaction Model
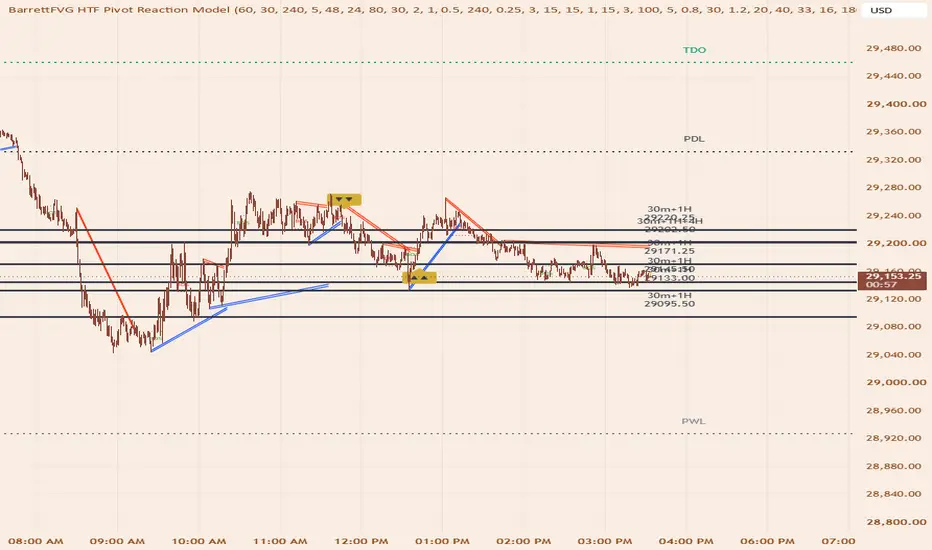
**BarrettFVG HTF Pivot Reaction Model**
Higher-timeframe swing levels that have to **earn** their place before they can produce a signal. Rather than plotting every pivot high and low from a higher timeframe and treating them all as equally valid, this indicator tracks how price has actually behaved at each level and only qualifies the ones price has demonstrably reacted to.
---
### The core idea
Most multi-timeframe S/R tools draw every HTF pivot as a level. The problem is that a swing high is just a price where the market happened to turn once — and one turn doesn't make an area meaningful. Some of those levels get respected repeatedly; most get cut straight through and never mattered.
This indicator separates the two by observation rather than assumption. Every 1H, 30m, and 15m pivot is tracked from the moment it forms, but it starts as a **Potential Level** — visible, monitored, and unable to produce any signal. It only becomes a qualified level once price has come back and genuinely reacted at it.
A **reaction** is defined mechanically:
1. Price enters the level's tolerance band
2. Price then moves away from it — in the direction the level should push it (down from a resistance, up from a support)
3. That move reaches a configurable distance, measured in multiples of the higher timeframe's ATR
Direction is enforced deliberately. A candle spiking straight through a level covers plenty of distance, but that's the opposite of respecting it, so only movement on the correct side counts. A sharp rejection and a slow stall-then-drift-away both qualify, as long as price eventually clears the required distance within the reaction window.
Each level displays its running reaction count, so you can see exactly how many times price has responded there.
---
### Levels
- **Three source timeframes**: 1H, 30m, and 15m by default, each individually toggleable and configurable
- **Automatic merging**: pivots from different timeframes landing within the same tolerance band become one level tagged with all of its sources (`15m+30m+1H`), keeping the accumulated reaction history rather than double-counting
- **Extended across the chart**: levels run in both directions, so a level formed days ago stays visible as a flat reference — a level is a price that stays relevant, not a segment tied to when it formed
- **Proximity display**: only the closest levels to current price are drawn, so the chart shows what's in play rather than every level in history
- **Two display modes**: a clean midpoint line, or the full tolerance band shown as a zone box so you can see exactly what the logic is using
**Timeframe consistency:** all sizing, ageing, and reaction timing is anchored to the higher timeframe's ATR and to real clock time rather than to chart bars. This means the same levels appear whether you're on a 1-minute chart or a 15-minute one. A bar-based implementation would silently produce different level sets on different chart timeframes from identical source data.
---
### Entry model
Two paths, both requiring a Break of Structure to fire:
**1 — TAP**
Price reaches a qualified level, taps it or slightly overshoots within a configurable tolerance, then breaks structure in the reversal direction. The overshoot allowance is what separates a tap from a break; beyond it, the level is treated as broken and only the reclaim path remains available.
**2 — RECLAIM (break and retest)**
Price breaks through the level, **builds structure on the far side**, then returns to the level and breaks structure back in the reversal direction.
The far-side structure requirement is the important part. A break only counts as significant once a confirmed swing forms beyond the level — for a broken resistance, that means a swing low printing above it, showing price pulled back up there and held. This is deliberately a *structural* test rather than a candle-size threshold: a single large wick through a level doesn't qualify, while a slow grind that builds a genuine swing does.
Both paths then wait for the same Break of Structure confirmation within a configurable bar window, using independent pivot tracking rather than the level's own geometry — so the confirmation is a real structural event, not a restatement of the level that armed it.
**Level flipping:** when a reclaim confirms, the level inverts its polarity. A resistance that price broke above and then held as support becomes a support level, marked with a flip indicator. This changes its behaviour, not just its appearance — future taps arm the correct direction from that point on.
---
### Signals and alerts
Entry markers plot as directional arrows on the confirming candle, with a dotted line showing the swing that broke to produce the BOS — anchored at the swing's actual formation bar so it points at the structure it's referencing.
Alerts carry the full context of what fired:
`MNQ1! — LONG RECLAIM | 1H+15m level @ 29,437.75 | 3 reactions`
Which entry path fired, which timeframes formed the level, the level's price, and how many times price has reacted there.
Signals are restricted to configurable trading session windows, with a cooldown preventing repeated same-direction entries off a single move.
**This indicator does not plot stop-loss or take-profit levels.** It identifies levels and signals entries; risk placement is left to the trader.
---
### Settings
Grouped by how often you'd change them:
1. **HTF Levels** — source timeframes, pivot length, band width, storage limits, level age
2. **Reaction Qualification** — minimum reactions, move-away distance, reaction window
3. **Entry Model** — path toggles, BOS pivot length and window, overshoot tolerance, cooldown
4. **Reclaim Structure** — far-side pivot length, retest window
5. **Sessions** — trading windows
6. **Display** — level visibility, colours, markers, labels
Every input has a tooltip explaining what it does and how it interacts with the rest.
---
### Notes on defaults
Defaults are **starting points, not optimised values.** They have not been backtested or tuned for any particular instrument or timeframe. The reaction distance, band width, and BOS window in particular will likely need adjusting for whatever you trade — start with Potential Levels visible so you can see what's being tracked and how quickly levels accumulate reactions before tightening anything.
Because reactions are earned through observed price behaviour rather than assumed from pivot geometry, levels start unqualified and accumulate history as the chart loads. Expect fewer qualified levels near the left edge of a freshly-loaded chart.
---
## Disclaimer
*This script is provided for educational and informational purposes only. It does not constitute financial, investment, or trading advice, nor a recommendation or solicitation to buy or sell any financial instrument.*
*Trading futures, forex, stocks, cryptocurrencies, and other leveraged instruments carries a substantial risk of loss and is not suitable for every investor. You may lose some or all of your invested capital, and with leveraged products you can lose more than your initial deposit. You should not trade with money you cannot afford to lose.*
*No indicator, system, or method can predict future price movement. The signals produced by this script are pattern-based observations derived from historical price data — they describe what has already happened, not what will happen next. Levels identified as "qualified" have met a mechanical definition of prior reaction; this does not imply price will react at them again.*
*Past performance, backtested results, hypothetical results, and historical signals are not indicative of future results. Backtested and hypothetical performance carries inherent limitations, including the benefit of hindsight and the absence of real execution factors such as slippage, spread, commissions, liquidity constraints, and the psychological pressures of live trading.*
*The default settings included with this script are unoptimised starting points. They have not been tuned or validated for any specific market, timeframe, account size, or risk tolerance. Test thoroughly on historical data and in simulation before considering any use with real capital.*
*This script does not plot or calculate stop-loss or take-profit levels. Position sizing, risk management, and trade management decisions are entirely the responsibility of the user.*
*You are solely responsible for your own trading decisions and for any outcomes resulting from them. The author makes no representations or warranties as to the accuracy, completeness, or suitability of this script for any purpose, and accepts no liability whatsoever for any losses, damages, or costs incurred through its use.*
Higher-timeframe swing levels that have to **earn** their place before they can produce a signal. Rather than plotting every pivot high and low from a higher timeframe and treating them all as equally valid, this indicator tracks how price has actually behaved at each level and only qualifies the ones price has demonstrably reacted to.
---
### The core idea
Most multi-timeframe S/R tools draw every HTF pivot as a level. The problem is that a swing high is just a price where the market happened to turn once — and one turn doesn't make an area meaningful. Some of those levels get respected repeatedly; most get cut straight through and never mattered.
This indicator separates the two by observation rather than assumption. Every 1H, 30m, and 15m pivot is tracked from the moment it forms, but it starts as a **Potential Level** — visible, monitored, and unable to produce any signal. It only becomes a qualified level once price has come back and genuinely reacted at it.
A **reaction** is defined mechanically:
1. Price enters the level's tolerance band
2. Price then moves away from it — in the direction the level should push it (down from a resistance, up from a support)
3. That move reaches a configurable distance, measured in multiples of the higher timeframe's ATR
Direction is enforced deliberately. A candle spiking straight through a level covers plenty of distance, but that's the opposite of respecting it, so only movement on the correct side counts. A sharp rejection and a slow stall-then-drift-away both qualify, as long as price eventually clears the required distance within the reaction window.
Each level displays its running reaction count, so you can see exactly how many times price has responded there.
---
### Levels
- **Three source timeframes**: 1H, 30m, and 15m by default, each individually toggleable and configurable
- **Automatic merging**: pivots from different timeframes landing within the same tolerance band become one level tagged with all of its sources (`15m+30m+1H`), keeping the accumulated reaction history rather than double-counting
- **Extended across the chart**: levels run in both directions, so a level formed days ago stays visible as a flat reference — a level is a price that stays relevant, not a segment tied to when it formed
- **Proximity display**: only the closest levels to current price are drawn, so the chart shows what's in play rather than every level in history
- **Two display modes**: a clean midpoint line, or the full tolerance band shown as a zone box so you can see exactly what the logic is using
**Timeframe consistency:** all sizing, ageing, and reaction timing is anchored to the higher timeframe's ATR and to real clock time rather than to chart bars. This means the same levels appear whether you're on a 1-minute chart or a 15-minute one. A bar-based implementation would silently produce different level sets on different chart timeframes from identical source data.
---
### Entry model
Two paths, both requiring a Break of Structure to fire:
**1 — TAP**
Price reaches a qualified level, taps it or slightly overshoots within a configurable tolerance, then breaks structure in the reversal direction. The overshoot allowance is what separates a tap from a break; beyond it, the level is treated as broken and only the reclaim path remains available.
**2 — RECLAIM (break and retest)**
Price breaks through the level, **builds structure on the far side**, then returns to the level and breaks structure back in the reversal direction.
The far-side structure requirement is the important part. A break only counts as significant once a confirmed swing forms beyond the level — for a broken resistance, that means a swing low printing above it, showing price pulled back up there and held. This is deliberately a *structural* test rather than a candle-size threshold: a single large wick through a level doesn't qualify, while a slow grind that builds a genuine swing does.
Both paths then wait for the same Break of Structure confirmation within a configurable bar window, using independent pivot tracking rather than the level's own geometry — so the confirmation is a real structural event, not a restatement of the level that armed it.
**Level flipping:** when a reclaim confirms, the level inverts its polarity. A resistance that price broke above and then held as support becomes a support level, marked with a flip indicator. This changes its behaviour, not just its appearance — future taps arm the correct direction from that point on.
---
### Signals and alerts
Entry markers plot as directional arrows on the confirming candle, with a dotted line showing the swing that broke to produce the BOS — anchored at the swing's actual formation bar so it points at the structure it's referencing.
Alerts carry the full context of what fired:
`MNQ1! — LONG RECLAIM | 1H+15m level @ 29,437.75 | 3 reactions`
Which entry path fired, which timeframes formed the level, the level's price, and how many times price has reacted there.
Signals are restricted to configurable trading session windows, with a cooldown preventing repeated same-direction entries off a single move.
**This indicator does not plot stop-loss or take-profit levels.** It identifies levels and signals entries; risk placement is left to the trader.
---
### Settings
Grouped by how often you'd change them:
1. **HTF Levels** — source timeframes, pivot length, band width, storage limits, level age
2. **Reaction Qualification** — minimum reactions, move-away distance, reaction window
3. **Entry Model** — path toggles, BOS pivot length and window, overshoot tolerance, cooldown
4. **Reclaim Structure** — far-side pivot length, retest window
5. **Sessions** — trading windows
6. **Display** — level visibility, colours, markers, labels
Every input has a tooltip explaining what it does and how it interacts with the rest.
---
### Notes on defaults
Defaults are **starting points, not optimised values.** They have not been backtested or tuned for any particular instrument or timeframe. The reaction distance, band width, and BOS window in particular will likely need adjusting for whatever you trade — start with Potential Levels visible so you can see what's being tracked and how quickly levels accumulate reactions before tightening anything.
Because reactions are earned through observed price behaviour rather than assumed from pivot geometry, levels start unqualified and accumulate history as the chart loads. Expect fewer qualified levels near the left edge of a freshly-loaded chart.
---
## Disclaimer
*This script is provided for educational and informational purposes only. It does not constitute financial, investment, or trading advice, nor a recommendation or solicitation to buy or sell any financial instrument.*
*Trading futures, forex, stocks, cryptocurrencies, and other leveraged instruments carries a substantial risk of loss and is not suitable for every investor. You may lose some or all of your invested capital, and with leveraged products you can lose more than your initial deposit. You should not trade with money you cannot afford to lose.*
*No indicator, system, or method can predict future price movement. The signals produced by this script are pattern-based observations derived from historical price data — they describe what has already happened, not what will happen next. Levels identified as "qualified" have met a mechanical definition of prior reaction; this does not imply price will react at them again.*
*Past performance, backtested results, hypothetical results, and historical signals are not indicative of future results. Backtested and hypothetical performance carries inherent limitations, including the benefit of hindsight and the absence of real execution factors such as slippage, spread, commissions, liquidity constraints, and the psychological pressures of live trading.*
*The default settings included with this script are unoptimised starting points. They have not been tuned or validated for any specific market, timeframe, account size, or risk tolerance. Test thoroughly on historical data and in simulation before considering any use with real capital.*
*This script does not plot or calculate stop-loss or take-profit levels. Position sizing, risk management, and trade management decisions are entirely the responsibility of the user.*
*You are solely responsible for your own trading decisions and for any outcomes resulting from them. The author makes no representations or warranties as to the accuracy, completeness, or suitability of this script for any purpose, and accepts no liability whatsoever for any losses, damages, or costs incurred through its use.*
Catatan Rilis
bug fixesCatatan Rilis
added accumulation zone detection and entries Catatan Rilis
Update — Timeframes, Accumulation, Key Levels & VWAPsNew
Third entry path: Accumulation. After a level tap, price often consolidates in a tight range instead of resolving. The range is tracked and drawn as a box, and an entry fires when price closes outside it — in whichever direction it leaves. No BOS required on this path.
Key levels: previous day high/low, previous week high/low, and the True Day Open (18:00 EST). Dotted, extending across the chart.
Two VWAPs: TDO VWAP anchors at 18:00 EST and runs continuously; NY VWAP anchors at 09:30 EST and disappears outside the session.
Changed
Default source timeframes are now 1H / 30m / 4H (15m removed — too fast for these levels). Labelled Timeframe 1/2/3 in settings; Timeframe 1 also supplies the ATR reference for the volatility-scaled settings.
Merge tolerance is now fixed at 48 ticks instead of ATR-scaled. Whether two pivots are one level or two is a question of chart precision, not volatility, and a scaled threshold reshuffled the level set as ATR drifted.
Touch tolerance split out as its own setting (24 ticks) — previously one value controlled both merging and what counted as a tap.
Entry timing is now measured in real minutes rather than bars: 15 minutes from tap to BOS, 30 minutes for an accumulation to form and break. Past those, a fresh tap is required.
Level display now draws the closest levels above and below current price, rather than a fixed count from each internal list.
BOS pivot length default lowered to 3.
Fixed
Level eviction at capacity dropped the oldest level, which was systematically discarding the most-proven ones. It now drops the weakest by reaction count.
Pivots only merged within their own support/resistance list, so a support and resistance pivot a few points apart stayed as two stacked lines. Merging now works across both.
A merged level keeps the higher timeframe's price rather than whichever registered first.
When several levels qualified on the same bar, which one armed the entry was arbitrary. The nearest to price now wins.
Key levels and VWAPs are display only — they do not arm, gate, or influence entries.
Catatan Rilis
Update — Entry Timing & DirectionFixed
Entry direction was taken from a level's stored support/resistance label rather than which side price approached from. A level keeps the type of the pivot that created it, so a "support" that price had fallen below could still fire a long when price came back up and tapped it from underneath. Direction is now captured when price first reaches the level: level below price → long, level above price → short.
Changed
Arm cooldown is now per direction. After a bullish setup arms, no other bullish setup can arm for 15 minutes — bearish is tracked separately and unaffected. Previously this was per level, which still allowed several clustered levels to arm the same direction one after another.
Tap-to-BOS window shortened to 5 minutes. The tap path is meant to catch price reaching a level and rejecting it quickly; a slow reaction is what the accumulation path is for.
Accumulation zone widened to 0.8 ATR, so it catches the looser consolidations that actually follow a level tap rather than only textbook ranges.
Accumulation breakouts now require above-average volume. A range that leaks out on thin volume is drift; a real breakout brings participation. This gates the entry, not the break — a weak break still ends the range, it just doesn't produce a trade.
The two entry paths now have deliberately opposite timing: tap proves itself by rejecting fast, accumulation by building slowly and breaking with volume.
Catatan Rilis
Update — Optional SL / TP Levels on SignalsNew section in settings: SL / TP Lines. Off by default — the indicator loads exactly as before until you turn it on.
Stop loss
Placed at the entry candle's own extreme — the low for longs, the high for shorts — plus a 4-tick buffer (adjustable). The logic is that the candle which triggered the signal defines the move: if price trades back through that bar's extreme, the reaction that produced the entry has failed. This makes the stop tight and specific to each signal rather than a fixed distance.
Take profit
The nearest reference price in the trade's direction. The search covers everything price actually reacts to, not just one category:
HTF pivot levels
Key levels — PDH, PDL, PWH, PWL, True Day Open
Both VWAPs
Each source has its own toggle. VWAP values are snapshotted at entry, so the target stays fixed rather than drifting with the VWAP after the signal fires.
Variable R:R
Because the target is wherever the next reference happens to sit, R:R changes on every signal — one setup may offer 1.4R, the next 3.8R. The ratio is printed on the TP label so it can be read before taking the trade.
A Minimum Target R:R setting (default 1.0) prevents a reference sitting a few ticks away from becoming the target — the search walks outward to the next one instead. If nothing in the trade's direction is far enough out, no lines are drawn. The entry marker still appears, but without a target there is nothing to draw, and inventing a level that is not there would be worse than showing nothing.
Lines extend as the trade runs and are removed once either side is reached.
Catatan Rilis
Update — Direction Fix, Entry Timing, SL/TP LevelsFixed
Entry direction was reading the wrong thing. It used the level's stored support/resistance label rather than which side price actually approached from. A level keeps the type of the pivot that created it, so a "support" price had already fallen below could still fire a LONG when price came back up and tapped it from underneath. Direction is now captured when price first reaches the level: level below price → long, level above price → short. A candle that pierces the level and closes through it can no longer flip the direction.
Level eviction at capacity dropped the oldest level, which systematically discarded the most-proven ones. It now drops the weakest by reaction count.
Pivots only merged within their own support/resistance list, so a support and a resistance pivot a few points apart stayed as two stacked lines. Merging now works across both.
A merged level now keeps the higher timeframe's price rather than whichever registered first.
When several levels qualified on the same bar, which one armed the entry was arbitrary. The nearest to price now wins.
New — SL / TP Levels (off by default)
Stop at the entry candle's extreme — the low for longs, the high for shorts — plus a 0.5 ATR buffer, so it scales with volatility rather than sitting a fixed distance away.
Target at the nearest reference price in the trade's direction, drawn from pivot levels, key levels (PDH/PDL/PWH/PWL/TDO) and both VWAPs. Each source has its own toggle. VWAP values are snapshotted at entry so the target stays fixed rather than drifting.
R:R therefore varies per signal and is printed on the TP label. The nearest reference is always used, even when that puts the trade under 1R — a close target is still information, and whether it's worth taking is your call.
Changed
Arm cooldown is now per direction. After a bullish setup arms, no other bullish setup can arm for 15 minutes; bearish is tracked separately. Previously per level, which still allowed clustered levels to arm the same direction one after another.
Tap-to-BOS window is 15 minutes. BOS asks price to clear a swing extreme, which is a real move and needs room — a short window mostly produces setups that expire unconfirmed rather than being rejected on merit.
Default source timeframes are 1H / 30m / 4H, labelled Timeframe 1/2/3. Timeframe 1 also supplies the ATR reference for the volatility-scaled settings.
Level max age raised to 30 days, with storage raised to 80 per side so capacity doesn't evict levels before they reach that age.
Accumulation zone widened to 0.8 ATR, and accumulation breakouts now require above-average volume.
Display
Level and key level labels are larger and easier to read at a glance.
Key level labels shift sideways when a pivot level sits close by, so the two no longer print on top of each other.
BOS confirmation lines are tagged at their midpoint, so it's clear what the break was measured against.
Key levels and VWAPs remain display only — they do not arm, gate, or influence entries.
Catatan Rilis
Update — Stop Placement & DefaultsStop loss reworked
Stops are no longer placed at the entry candle's extreme. That reference had a logical flaw: entry fires on the BOS candle, minutes after the reaction, so by then the candle sits on the wrong side of the level. Price could stop you out while the level itself was still perfectly intact.
The stop reference now follows the path that produced the trade:
TAP and RECLAIM — beyond the level that produced the entry. That is the actual invalidation point: the thesis is that the level holds, so if price trades through it the trade is wrong.
ACCUMULATION — beyond the far side of the range. There the thesis is that price has left the range, so trading back through to the opposite edge says it has not. The level that started the range is usually irrelevant by that point.
Buffer is 8 ticks (2 points on MNQ), replacing the previous ATR-scaled version. The SL Placement dropdown is gone — one reference rule per path, one buffer.
Changed
Max overshoot on a tap lowered to 0.25 ATR. At 0.5 price could trade roughly 28 points past a level and still register as a tap rather than a break, which let setups stay armed long after the level had failed.
SL / TP lines now draw by default.
VWAPs are off by default, both as chart display and as take-profit targets. Targets now come from pivot levels and key levels only, which generally places them further out.
Catatan Rilis
Update — Stop Placement, Label Layout, DefaultsStop loss reworked
Stops no longer sit at the entry candle's extreme. That reference had a flaw: entry fires on the BOS candle, minutes after the reaction, so by then the candle is on the wrong side of the level — price could stop you out while the level itself was still perfectly intact.
The reference now follows the path that produced the trade:
TAP and RECLAIM — beyond the level that produced the entry. That is the real invalidation: the thesis is that the level holds, so if price trades through it the trade is wrong.
ACCUMULATION — beyond the far side of the range. There the thesis is that price has left the range, so trading back to the opposite edge says it has not. The level that started the range is usually irrelevant by then.
Buffer is 8 ticks (2 points on MNQ), replacing the ATR-scaled version. The SL Placement dropdown is gone — one rule per path, one buffer.
Labels
Key level labels now occupy their own horizontal lane, so they can never overlap the pivot level labels at any price.
Within that lane, key levels sitting at similar prices stack into separate columns instead of printing on top of each other. Previously only pivot-vs-key collisions were handled, so PDH beside PWH still overlapped.
New Label Size setting — Tiny through Huge.
Reaction counts removed from labels. Still tracked, and still what separates a qualified level from a Potential one, just no longer displayed.
Both label sets moved closer to price.
Changed
Max overshoot on a tap lowered to 0.25 ATR. At 0.5, price could trade roughly 28 points past a level and still register as a tap rather than a break, leaving setups armed long after the level had failed.
SL / TP lines now draw by default.
VWAPs off by default, both as chart display and as take-profit targets. Targets now come from pivot levels and key levels only, which generally places them further out.
Catatan Rilis
bug fixes with alerts Catatan Rilis
Major Update — Trendline ConfluenceThe trendline engine is now built into this indicator, so entries can require confirmation from both models at once. Previously that check had to be made by eye across two separate scripts; Pine gives indicators no way to read each other, so combining them was the only route.
Trendlines
A verbatim port of the standalone Trendline indicator's channel engine — same pivot detection, same four-pivot validity test, same retroactive invalidation sweep, same ATR padding. None of that indicator's gates came with it. This is the raw geometry only, so a break here means exactly what a break means on that chart.
Channels draw with fills, and the last five broken ones are kept per side.
One deliberate difference: a break requires the CLOSE to finish beyond the channel's far edge. The standalone version fires on the whole candle clearing it. Closing through the channel is the definition being traded — a full shift to the other side rather than a probe that leaves a wick behind.
If you run both indicators, set Pivot Period and Channel Padding to matching values or the two charts will disagree.
Confluence
A gold marker prints when a pivot entry is confirmed by one of two things:
An opposing trendline break. A long needs the bearish descending channel broken upward. The pairing gets a window in both directions, because either can lead in practice: the break may already have happened (up to 5 bars back), or the entry may fire first and the break follow (up to 2 bars forward). In the forward case the marker prints on the break bar.
A major level. PDH, PDL, PWH and PWL are treated as strong enough alone — an entry moving away from one of them qualifies with no trendline involved. TDO is excluded; it is an opening price, not a level price has repeatedly respected. Only levels currently drawn on the chart count, and they use the same touch tolerance as the pivot levels.
The marker's tooltip names which route qualified it.
Entry Markers Shown
A three-way setting controlling both markers and alerts, so the chart and your alerts always agree:
Confluence only (default) — gold markers and gold alerts, nothing else
All markers — every pivot entry plus gold markers on the qualifying ones
Raw signals only — pivot entries with no confluence layer
On All markers, a confluence entry produces both alerts on that bar. They carry different information, so both are sent.
Also changed
Three levels shown per side, up from two.
Catatan Rilis
alert and SL/TP bug fixesCatatan Rilis
More alert bug fixes. multiple alerts firing on one entry signal Catatan Rilis
additional alert fixes Catatan Rilis
made level lines thicker depending on how many timeframes agree with that level. 1 timeframe 2 thickness. 2 timeframes the level has a thickness of 3 and 3 timeframes the level has a thickness of 4 Catatan Rilis
Update — Level Qualification & Risk PlacementLevels now need more than one timeframe to qualify
A level must have been printed by at least two of the three source timeframes before it can arm an entry. A bare 30m level stays Potential and never fires; only levels with 1H or 4H agreement behind them are tradeable.
This is the least ambiguous measure of significance available here — two timeframes independently marking the same price means more than one did, with nothing to interpret. Unlike reaction count it is known the moment the level forms, so a genuinely significant fresh level is not held back waiting to earn it. Minimum reactions is back to 1 as a result: significance now comes from structure, and the reaction just confirms price noticed.
Potential levels are hidden by default. They are still tracked, so turning them back on costs nothing.
Stops moved to structure
Stops previously sat beyond the level that produced the entry. That reference had a timing problem: entry fires on the BOS candle, up to the full confirmation window after the tap, so by then price has moved away and the level sits well behind — the stop was protecting something price had already left.
The stop now sits beyond the last confirmed swing before entry, the structure the leg launched from. If price takes out the low the move began from, the move is over regardless of where the level was. This applies to all three entry paths including accumulation, which previously used the far side of its range.
New Structure Pivot Length setting controls which swing is used: higher finds the origin of the larger move, lower finds the nearest minor swing and gives a tighter stop.
Buffer reduced to 4 ticks.
Targets are a fixed 1R
Previously the target was the nearest reference price clearing a minimum R:R. That made reward depend on where the next shelf happened to sit rather than on the trade itself — a good setup with a nearby level got a poor target, and the same setup with clear space above got a generous one.
Target is now a multiple of the stop distance, so reward scales with the trade's own risk. The multiple is adjustable.
One trade shown at a time
SL and TP lines are replaced when a new signal fires rather than accumulating, so what is on the chart is the trade currently in play. Lines extend as it runs and clear once either side is touched.

Pernyataan Penyangkalan
Informasi dan publikasi ini tidak dimaksudkan, dan bukan merupakan, saran atau rekomendasi keuangan, investasi, trading, atau jenis lainnya yang diberikan atau didukung oleh TradingView. Baca selengkapnya di Ketentuan Penggunaan.
Pernyataan Penyangkalan
Informasi dan publikasi ini tidak dimaksudkan, dan bukan merupakan, saran atau rekomendasi keuangan, investasi, trading, atau jenis lainnya yang diberikan atau didukung oleh TradingView. Baca selengkapnya di Ketentuan Penggunaan.