Quant Volatility & Regime [AlgoChief]
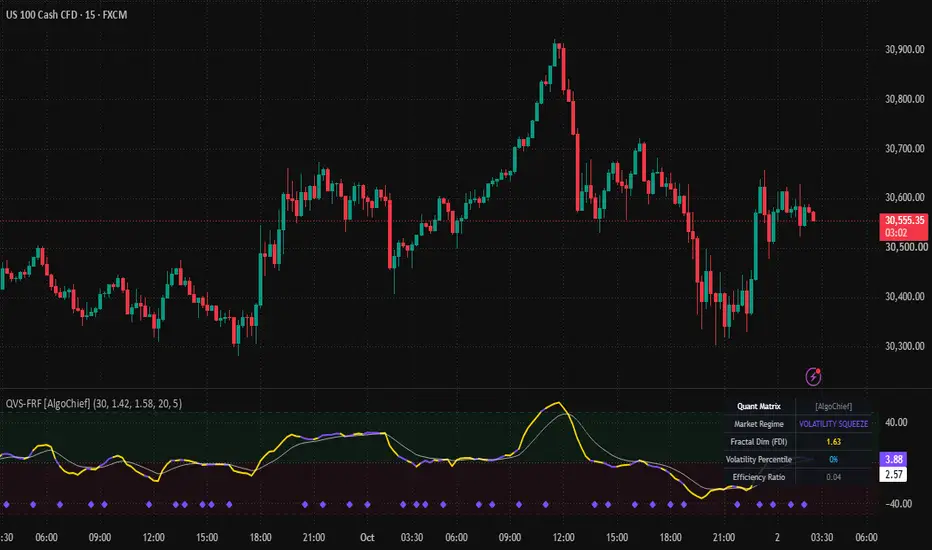
OVERVIEW AND QUANTITATIVE PHILOSOPHY
Most indicators fail because they apply trend-following math to range-bound chop, or oscillator mean-reversion math to explosive trending regimes. Financial asset prices alternate between distinct mathematical states: Persistent Trending, Mean-Reverting Anti-Persistent Noise, and Volatility Compression Squeezes.
The [AlgoChief] Adaptive Quant Volatility Surface & Fractal Regime Filter solves this fundamental problem. It combines the Garman-Klass Multi-Point Volatility Estimator with Fractal Dimension Index (FDI) mathematics and Efficiency Ratio kinematics to classify the exact regime of any financial instrument without relying on lag-heavy moving averages.
MATHEMATICAL ARCHITECTURE
1. GARMAN-KLASS VOLATILITY SURFACE
Standard standard deviation only evaluates close-to-close metrics, ignoring intraday price dynamics. The Garman-Klass algorithm integrates High, Low, Open, and Close geometric logs:
- Captures true variance up to 800% more efficiently than classical volatility metrics.
- Computes volatility spikes and micro-compressions with instant mathematical sensitivity.
2. FRACTAL DIMENSION INDEX (FDI) KINEMATICS
Derived from Mandelbrot fractal geometry, FDI quantifies the roughness and space-filling properties of price trajectories:
- FDI near 1.00 indicates pure directional persistence (Super-Trend state where trend-following is optimal).
- FDI near 1.50 represents a Gaussian Random Walk (Unpredictable Brownian noise).
- FDI above 1.55 signifies Mean-Reversion (Anti-persistent boundaries where range trading thrives).
3. REGIME VECTOR SCORE (-100 TO +100)
A continuous institutional score calculated by synthesizing Directional Persistence, Volatility Z-Score, and Price Efficiency.
4. DYNAMIC REGIME CLASSIFICATION STATES
The engine autonomously outputs 4 distinct market states:
- Explosive Expansion: Massive institutional momentum. Ride the trend with trailing stops.
- Directional Drift: Controlled trend progression. Favorable for dip buying / rally selling.
- Mean-Reversion Channel: Range-bound consolidation. High risk for trend breakouts; ideal for oscillator fades.
- Volatility Squeeze: Energy compression preceding explosive institutional breakouts.
HOW TO USE THIS INDICATOR
Trend Following Strategy:
- Check the Regime Matrix HUD. When State is EXPLOSIVE EXPANSION or DIRECTIONAL DRIFT and the Regime Curve is above the Upper Quant Band, hold trend positions with confidence.
Mean Reversion Strategy:
- When State reads MEAN-REVERSION or COMPRESSION and the curve oscillates between the equilibrium bands, fade extreme edges and avoid breakout trades.
Breakout Anticipation:
- When Volatility Surface turns deep purple/gray (Compression Squeeze) and FDI rises above 1.55, prepare for a violent explosive regime transition.
INPUT SETTINGS BREAKDOWN
- Fractal Calculation Length: Number of historical bars used to evaluate geometric curve roughness.
- Volatility Lookback Period: Window size for the Garman-Klass variance integration.
- Smoothing Kernel: High-frequency noise suppression using low-lag exponential weighting.
- Telemetry Matrix Position: Fixed top-right institutional HUD display.
RISK NOTICE
Statistical regime classification models estimate structural probabilities based on historical distribution dynamics. Market dislocations and extreme macroeconomic events can rapidly alter price distributions. Use proper stop-loss protocols and never over-leverage.

For access & queries: algochiefsupport@gmail.com
Pernyataan Penyangkalan
Informasi dan publikasi ini tidak dimaksudkan, dan bukan merupakan, saran atau rekomendasi keuangan, investasi, trading, atau jenis lainnya yang diberikan atau didukung oleh TradingView. Baca selengkapnya di Ketentuan Penggunaan.
For access & queries: algochiefsupport@gmail.com
Pernyataan Penyangkalan
Informasi dan publikasi ini tidak dimaksudkan, dan bukan merupakan, saran atau rekomendasi keuangan, investasi, trading, atau jenis lainnya yang diberikan atau didukung oleh TradingView. Baca selengkapnya di Ketentuan Penggunaan.