OPEN-SOURCE SCRIPT
VP AERA ANCHORED
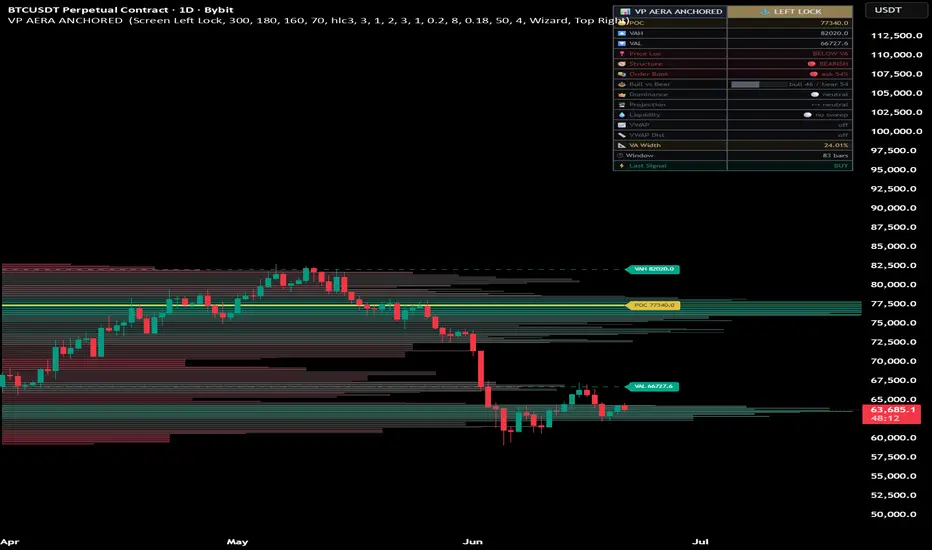
vp aera anchored
vp aera anchored is an anchored volume profile tool designed to display a fixed market profile from a selected anchor point, with value area levels, poc, vah, val, anchored vwap levels, market structure context, liquidity information, bull versus bear pressure, dominance, projection and a compact institutional dashboard.
the goal of this tool is to help traders read where volume has been accepted, where price is reacting around value, and whether current conditions are showing more bullish, bearish or neutral pressure.
this indicator is designed for market analysis. it does not place trades, does not predict the future and does not guarantee any result. every signal and level should be confirmed with price action, market structure, liquidity, session context and risk management.
main concept
the script builds a volume profile from a chosen anchor window.
the profile shows where volume was concentrated inside the selected range.
the poc marks the highest volume price area.
the vah marks the upper boundary of the value area.
the val marks the lower boundary of the value area.
the anchored vwap levels show the average traded price of the selected window and multiple deviation levels around it.
the dashboard summarizes useful information such as price location, structure, order book proxy, bull versus bear balance, dominance, projection, liquidity, vwap distance, value area width, window size and last signal.
anchor modes
screen left lock
this mode anchors the profile to the left side of the visible chart.
when you move or zoom the chart, the profile recalculates from the visible left edge.
this is useful for active chart reading and discretionary analysis.
bars back
this mode uses a fixed number of bars.
for example, if bars back is set to 300, the profile uses the last 300 bars.
this is useful when you want a stable rolling profile.
date
this mode starts the profile from a selected date.
this is useful for anchored analysis from a major high, major low, news event, session start, weekly open, monthly open or important market turning point.
profile settings
rows
controls the resolution of the volume profile.
more rows create a more detailed profile with thinner price levels.
fewer rows create a smoother and simpler profile.
max profile width
controls the visual width of the profile on the chart.
higher values make the profile extend further to the right.
lower values keep the profile compact.
high-resolution volume distribution
when enabled, volume is distributed across the full candle range.
this gives a more refined profile than assigning all candle volume to one price area.
delta coloring
when enabled, the profile colors rows using a buy versus sell split proxy.
when disabled, the profile uses a volume intensity gradient.
value area settings
value area percentage
sets how much volume is included in the value area.
the default value is commonly used to represent the main area of volume acceptance.
poc
shows the point of control.
the poc is the price area with the highest traded volume inside the selected profile window.
vah
shows the upper value area boundary.
price above vah can indicate that price is trading above the main accepted value area.
val
shows the lower value area boundary.
price below val can indicate that price is trading below the main accepted value area.
extend levels to current bar
when enabled, poc, vah, val and vwap levels extend toward the current bar.
this makes the levels easier to use as active reference zones.
anchored vwap levels
the anchored vwap is calculated from the same window as the volume profile.
this makes it aligned with the selected anchor instead of using a standard session-only vwap.
vwap
the central anchored vwap line shows the volume-weighted average price of the selected profile window.
vwap plus 1 sigma and vwap minus 1 sigma
these are the first deviation levels around anchored vwap.
they can act as normal reaction zones during balanced market conditions.
vwap plus 2 sigma and vwap minus 2 sigma
these are wider deviation levels.
they can help identify stronger extension from the anchored average.
vwap plus 3 sigma and vwap minus 3 sigma
these are extreme deviation levels.
they can help identify stretched market conditions, but they should not be used alone as reversal signals.
how to use vwap levels
when price is above anchored vwap, the window is generally showing stronger bullish positioning.
when price is below anchored vwap, the window is generally showing stronger bearish positioning.
when price returns to anchored vwap after an extension, the level can act as a balance or reaction zone.
when price holds above vwap and rejects lower deviation levels, buyers may still be defending value.
when price holds below vwap and rejects upper deviation levels, sellers may still be defending value.
dashboard guide
price loc
shows whether price is above value, below value or inside value.
above value can show bullish expansion.
below value can show bearish expansion.
inside value can show balance or consolidation.
structure
shows the current structural bias based on market structure logic.
bullish means price has recently shown bullish structure.
bearish means price has recently shown bearish structure.
neutral means no clear structural bias is active.
order book
this is a proxy reading based on volume and candle range behavior.
it is not direct exchange order book data.
bid means the proxy is leaning toward buyer pressure.
ask means the proxy is leaning toward seller pressure.
bull vs bear
shows a simple pressure gauge.
the gauge stays in the original bar style.
green means bull pressure is dominant.
red means bear pressure is dominant.
the numbers show the estimated bull and bear balance.
dominance
shows which side currently dominates the pressure model.
bull dominance means buyer pressure is stronger.
bear dominance means seller pressure is stronger.
neutral means neither side has a strong advantage.
projection
summarizes the current read from signal, structure, value and pressure context.
bullish projection means conditions are leaning upward.
bearish projection means conditions are leaning downward.
neutral projection means conditions are not clearly directional.
liquidity
shows whether a recent liquidity sweep is detected.
low sweep can show downside liquidity being taken before a possible recovery.
high sweep can show upside liquidity being taken before a possible rejection.
no sweep means no active sweep is detected.
vwap
shows the anchored vwap value when vwap levels are enabled.
vwap dist
shows how far price is from anchored vwap in percentage terms.
positive distance means price is above anchored vwap.
negative distance means price is below anchored vwap.
va width
shows the width of the value area as a percentage of price.
a narrow value area can suggest compression.
a wide value area can suggest broader distribution.
window
shows how many bars are used in the current profile calculation.
last signal
shows the most recent buy or sell signal generated by the script logic.
buy and sell engine
the signal engine combines several filters.
liquidity sweep
the script can require price to sweep a previous swing before triggering.
bos or choch confirmation
the script can require structural confirmation.
test at va edge or poc
the script can require price to react near val, vah or poc.
ema trend filter
the script can optionally require price to align with an ema trend filter.
signal cooldown
the cooldown prevents too many signals from appearing too close together.
beginner tutorial
step 1: start with screen left lock
use screen left lock when learning.
zoom the chart so the visible window starts from an important swing high, swing low or consolidation.
the profile will build from the left visible edge.
step 2: read poc first
find the poc.
if price is above poc, buyers may have control of the current profile window.
if price is below poc, sellers may have control of the current profile window.
if price is moving around poc, the market may be balanced.
step 3: read vah and val
vah is the upper value boundary.
val is the lower value boundary.
inside vah and val, price is inside accepted value.
outside vah and val, price is outside the main accepted value area.
step 4: enable anchored vwap levels
turn on anchored vwap levels when you want an extra institutional reference.
watch how price reacts to vwap, plus 1 sigma, minus 1 sigma, plus 2 sigma and minus 2 sigma.
step 5: use the dashboard
check price loc, structure, order book, bull vs bear, dominance and projection.
do not use one line alone.
look for agreement between several dashboard rows.
step 6: confirm with the chart
before using any signal, check:
trend direction
support and resistance
market structure
candle close
volume reaction
session context
risk to reward
step 7: avoid blind entries
a buy signal near val or vwap support can be stronger than a buy signal in the middle of nowhere.
a sell signal near vah or vwap resistance can be stronger than a sell signal in the middle of nowhere.
example 1: bullish value reaction
price trades near val.
liquidity shows a low sweep.
structure turns bullish.
bull vs bear becomes green.
price reclaims anchored vwap.
this can suggest that buyers are defending value and that downside liquidity was absorbed.
a beginner should still wait for a candle close and define invalidation below the reaction zone.
example 2: bearish value rejection
price trades near vah.
liquidity shows a high sweep.
structure turns bearish.
bull vs bear becomes red.
price rejects anchored vwap or an upper vwap deviation level.
this can suggest that sellers are defending the upper value area.
a beginner should still wait for price confirmation and define invalidation above the rejection zone.
example 3: balanced market
price is inside the value area.
price is close to poc.
dashboard projection is neutral.
dominance is neutral.
bull vs bear is close to 50 and 50.
this means the market is not clearly directional.
a beginner should avoid forcing trades and wait for price to leave value or react at a stronger level.
example 4: trend continuation above value
price is above vah.
structure is bullish.
bull pressure is dominant.
price holds above anchored vwap.
pullbacks to vah or vwap may become continuation areas.
a beginner should avoid shorting only because price looks high.
example 5: bearish continuation below value
price is below val.
structure is bearish.
bear pressure is dominant.
price holds below anchored vwap.
pullbacks toward val or vwap may become rejection areas.
a beginner should avoid buying only because price looks low.
example 6: vwap extension
price moves far above vwap plus 2 sigma or plus 3 sigma.
this shows strong upside extension.
it can continue during strong trends.
wait for loss of structure, rejection or dashboard shift before assuming reversal.
example 7: vwap mean reversion
price moves away from anchored vwap and later returns to it.
anchored vwap can become a reaction zone.
if price accepts above it, buyers may regain control.
if price rejects below it, sellers may remain in control.
suggested beginner settings
anchor mode: screen left lock
rows: default
value area: default
show poc: on
show vah and val: on
extend levels: on
anchored vwap levels: off at first, then on when comfortable
vwap deviation levels: 3
enable signals: on
require liquidity sweep: on
require bos or choch confirmation: on
require va edge or poc: on
ema trend filter: optional
practical workflow
choose the anchor mode.
identify the current poc, vah and val.
check if price is inside value, above value or below value.
enable anchored vwap levels if needed.
watch the dashboard for structure, dominance and bull versus bear pressure.
wait for price to react at poc, vah, val, anchored vwap or vwap deviation levels.
confirm with candle close and market structure.
plan risk before any trade idea.
best use cases
anchored volume profile analysis
value area trading
poc reaction analysis
anchored vwap confluence
bull versus bear pressure reading
liquidity sweep context
trend continuation analysis
reversal preparation
range and balance identification
discretionary trading confirmation
important limitations
the order book row is a proxy, not direct order book data.
vwap levels are based on the selected profile window.
signals are based on historical chart data.
strong trends can stay above value or below value for a long time.
a level is not a trade by itself.
no indicator can guarantee direction, win rate or profit.
risk note
this tool is made for technical analysis and educational market study. it should be used with independent confirmation, proper position sizing and risk management.
vp aera anchored is an anchored volume profile tool designed to display a fixed market profile from a selected anchor point, with value area levels, poc, vah, val, anchored vwap levels, market structure context, liquidity information, bull versus bear pressure, dominance, projection and a compact institutional dashboard.
the goal of this tool is to help traders read where volume has been accepted, where price is reacting around value, and whether current conditions are showing more bullish, bearish or neutral pressure.
this indicator is designed for market analysis. it does not place trades, does not predict the future and does not guarantee any result. every signal and level should be confirmed with price action, market structure, liquidity, session context and risk management.
main concept
the script builds a volume profile from a chosen anchor window.
the profile shows where volume was concentrated inside the selected range.
the poc marks the highest volume price area.
the vah marks the upper boundary of the value area.
the val marks the lower boundary of the value area.
the anchored vwap levels show the average traded price of the selected window and multiple deviation levels around it.
the dashboard summarizes useful information such as price location, structure, order book proxy, bull versus bear balance, dominance, projection, liquidity, vwap distance, value area width, window size and last signal.
anchor modes
screen left lock
this mode anchors the profile to the left side of the visible chart.
when you move or zoom the chart, the profile recalculates from the visible left edge.
this is useful for active chart reading and discretionary analysis.
bars back
this mode uses a fixed number of bars.
for example, if bars back is set to 300, the profile uses the last 300 bars.
this is useful when you want a stable rolling profile.
date
this mode starts the profile from a selected date.
this is useful for anchored analysis from a major high, major low, news event, session start, weekly open, monthly open or important market turning point.
profile settings
rows
controls the resolution of the volume profile.
more rows create a more detailed profile with thinner price levels.
fewer rows create a smoother and simpler profile.
max profile width
controls the visual width of the profile on the chart.
higher values make the profile extend further to the right.
lower values keep the profile compact.
high-resolution volume distribution
when enabled, volume is distributed across the full candle range.
this gives a more refined profile than assigning all candle volume to one price area.
delta coloring
when enabled, the profile colors rows using a buy versus sell split proxy.
when disabled, the profile uses a volume intensity gradient.
value area settings
value area percentage
sets how much volume is included in the value area.
the default value is commonly used to represent the main area of volume acceptance.
poc
shows the point of control.
the poc is the price area with the highest traded volume inside the selected profile window.
vah
shows the upper value area boundary.
price above vah can indicate that price is trading above the main accepted value area.
val
shows the lower value area boundary.
price below val can indicate that price is trading below the main accepted value area.
extend levels to current bar
when enabled, poc, vah, val and vwap levels extend toward the current bar.
this makes the levels easier to use as active reference zones.
anchored vwap levels
the anchored vwap is calculated from the same window as the volume profile.
this makes it aligned with the selected anchor instead of using a standard session-only vwap.
vwap
the central anchored vwap line shows the volume-weighted average price of the selected profile window.
vwap plus 1 sigma and vwap minus 1 sigma
these are the first deviation levels around anchored vwap.
they can act as normal reaction zones during balanced market conditions.
vwap plus 2 sigma and vwap minus 2 sigma
these are wider deviation levels.
they can help identify stronger extension from the anchored average.
vwap plus 3 sigma and vwap minus 3 sigma
these are extreme deviation levels.
they can help identify stretched market conditions, but they should not be used alone as reversal signals.
how to use vwap levels
when price is above anchored vwap, the window is generally showing stronger bullish positioning.
when price is below anchored vwap, the window is generally showing stronger bearish positioning.
when price returns to anchored vwap after an extension, the level can act as a balance or reaction zone.
when price holds above vwap and rejects lower deviation levels, buyers may still be defending value.
when price holds below vwap and rejects upper deviation levels, sellers may still be defending value.
dashboard guide
price loc
shows whether price is above value, below value or inside value.
above value can show bullish expansion.
below value can show bearish expansion.
inside value can show balance or consolidation.
structure
shows the current structural bias based on market structure logic.
bullish means price has recently shown bullish structure.
bearish means price has recently shown bearish structure.
neutral means no clear structural bias is active.
order book
this is a proxy reading based on volume and candle range behavior.
it is not direct exchange order book data.
bid means the proxy is leaning toward buyer pressure.
ask means the proxy is leaning toward seller pressure.
bull vs bear
shows a simple pressure gauge.
the gauge stays in the original bar style.
green means bull pressure is dominant.
red means bear pressure is dominant.
the numbers show the estimated bull and bear balance.
dominance
shows which side currently dominates the pressure model.
bull dominance means buyer pressure is stronger.
bear dominance means seller pressure is stronger.
neutral means neither side has a strong advantage.
projection
summarizes the current read from signal, structure, value and pressure context.
bullish projection means conditions are leaning upward.
bearish projection means conditions are leaning downward.
neutral projection means conditions are not clearly directional.
liquidity
shows whether a recent liquidity sweep is detected.
low sweep can show downside liquidity being taken before a possible recovery.
high sweep can show upside liquidity being taken before a possible rejection.
no sweep means no active sweep is detected.
vwap
shows the anchored vwap value when vwap levels are enabled.
vwap dist
shows how far price is from anchored vwap in percentage terms.
positive distance means price is above anchored vwap.
negative distance means price is below anchored vwap.
va width
shows the width of the value area as a percentage of price.
a narrow value area can suggest compression.
a wide value area can suggest broader distribution.
window
shows how many bars are used in the current profile calculation.
last signal
shows the most recent buy or sell signal generated by the script logic.
buy and sell engine
the signal engine combines several filters.
liquidity sweep
the script can require price to sweep a previous swing before triggering.
bos or choch confirmation
the script can require structural confirmation.
test at va edge or poc
the script can require price to react near val, vah or poc.
ema trend filter
the script can optionally require price to align with an ema trend filter.
signal cooldown
the cooldown prevents too many signals from appearing too close together.
beginner tutorial
step 1: start with screen left lock
use screen left lock when learning.
zoom the chart so the visible window starts from an important swing high, swing low or consolidation.
the profile will build from the left visible edge.
step 2: read poc first
find the poc.
if price is above poc, buyers may have control of the current profile window.
if price is below poc, sellers may have control of the current profile window.
if price is moving around poc, the market may be balanced.
step 3: read vah and val
vah is the upper value boundary.
val is the lower value boundary.
inside vah and val, price is inside accepted value.
outside vah and val, price is outside the main accepted value area.
step 4: enable anchored vwap levels
turn on anchored vwap levels when you want an extra institutional reference.
watch how price reacts to vwap, plus 1 sigma, minus 1 sigma, plus 2 sigma and minus 2 sigma.
step 5: use the dashboard
check price loc, structure, order book, bull vs bear, dominance and projection.
do not use one line alone.
look for agreement between several dashboard rows.
step 6: confirm with the chart
before using any signal, check:
trend direction
support and resistance
market structure
candle close
volume reaction
session context
risk to reward
step 7: avoid blind entries
a buy signal near val or vwap support can be stronger than a buy signal in the middle of nowhere.
a sell signal near vah or vwap resistance can be stronger than a sell signal in the middle of nowhere.
example 1: bullish value reaction
price trades near val.
liquidity shows a low sweep.
structure turns bullish.
bull vs bear becomes green.
price reclaims anchored vwap.
this can suggest that buyers are defending value and that downside liquidity was absorbed.
a beginner should still wait for a candle close and define invalidation below the reaction zone.
example 2: bearish value rejection
price trades near vah.
liquidity shows a high sweep.
structure turns bearish.
bull vs bear becomes red.
price rejects anchored vwap or an upper vwap deviation level.
this can suggest that sellers are defending the upper value area.
a beginner should still wait for price confirmation and define invalidation above the rejection zone.
example 3: balanced market
price is inside the value area.
price is close to poc.
dashboard projection is neutral.
dominance is neutral.
bull vs bear is close to 50 and 50.
this means the market is not clearly directional.
a beginner should avoid forcing trades and wait for price to leave value or react at a stronger level.
example 4: trend continuation above value
price is above vah.
structure is bullish.
bull pressure is dominant.
price holds above anchored vwap.
pullbacks to vah or vwap may become continuation areas.
a beginner should avoid shorting only because price looks high.
example 5: bearish continuation below value
price is below val.
structure is bearish.
bear pressure is dominant.
price holds below anchored vwap.
pullbacks toward val or vwap may become rejection areas.
a beginner should avoid buying only because price looks low.
example 6: vwap extension
price moves far above vwap plus 2 sigma or plus 3 sigma.
this shows strong upside extension.
it can continue during strong trends.
wait for loss of structure, rejection or dashboard shift before assuming reversal.
example 7: vwap mean reversion
price moves away from anchored vwap and later returns to it.
anchored vwap can become a reaction zone.
if price accepts above it, buyers may regain control.
if price rejects below it, sellers may remain in control.
suggested beginner settings
anchor mode: screen left lock
rows: default
value area: default
show poc: on
show vah and val: on
extend levels: on
anchored vwap levels: off at first, then on when comfortable
vwap deviation levels: 3
enable signals: on
require liquidity sweep: on
require bos or choch confirmation: on
require va edge or poc: on
ema trend filter: optional
practical workflow
choose the anchor mode.
identify the current poc, vah and val.
check if price is inside value, above value or below value.
enable anchored vwap levels if needed.
watch the dashboard for structure, dominance and bull versus bear pressure.
wait for price to react at poc, vah, val, anchored vwap or vwap deviation levels.
confirm with candle close and market structure.
plan risk before any trade idea.
best use cases
anchored volume profile analysis
value area trading
poc reaction analysis
anchored vwap confluence
bull versus bear pressure reading
liquidity sweep context
trend continuation analysis
reversal preparation
range and balance identification
discretionary trading confirmation
important limitations
the order book row is a proxy, not direct order book data.
vwap levels are based on the selected profile window.
signals are based on historical chart data.
strong trends can stay above value or below value for a long time.
a level is not a trade by itself.
no indicator can guarantee direction, win rate or profit.
risk note
this tool is made for technical analysis and educational market study. it should be used with independent confirmation, proper position sizing and risk management.
Skrip open-source
Dengan semangat TradingView yang sesungguhnya, pembuat skrip ini telah menjadikannya sebagai sumber terbuka, sehingga para trader dapat meninjau dan memverifikasi fungsinya. Salut untuk penulisnya! Meskipun Anda dapat menggunakannya secara gratis, perlu diingat bahwa penerbitan ulang kode ini tunduk pada Tata Tertib kami.

Light the candle that sleeps within you.
Pernyataan Penyangkalan
Informasi dan publikasi ini tidak dimaksudkan, dan bukan merupakan, saran atau rekomendasi keuangan, investasi, trading, atau jenis lainnya yang diberikan atau didukung oleh TradingView. Baca selengkapnya di Ketentuan Penggunaan.
Skrip open-source
Dengan semangat TradingView yang sesungguhnya, pembuat skrip ini telah menjadikannya sebagai sumber terbuka, sehingga para trader dapat meninjau dan memverifikasi fungsinya. Salut untuk penulisnya! Meskipun Anda dapat menggunakannya secara gratis, perlu diingat bahwa penerbitan ulang kode ini tunduk pada Tata Tertib kami.
Light the candle that sleeps within you.
Pernyataan Penyangkalan
Informasi dan publikasi ini tidak dimaksudkan, dan bukan merupakan, saran atau rekomendasi keuangan, investasi, trading, atau jenis lainnya yang diberikan atau didukung oleh TradingView. Baca selengkapnya di Ketentuan Penggunaan.