Diupdate
30 Min Pivot
Overview
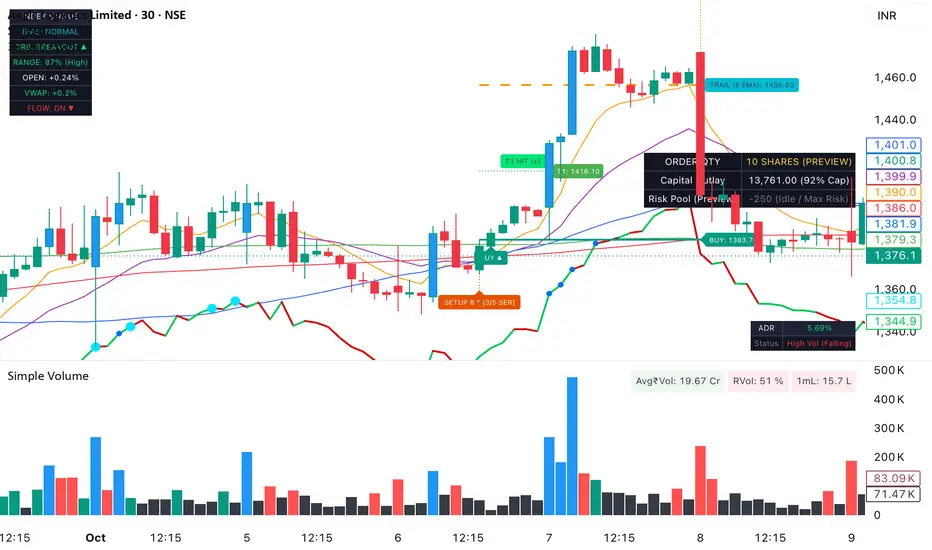
The 30 Min Pivot Pullback Strategy is an execution toolkit designed for momentum and swing traders. Inspired by Mark Minervini's Volatility Contraction Pattern (VCP), William O'Neil's CANSLIM principles, and Patrick Walker's moving average pullback framework, this tool bridges the gap between daily macro trend identification and precise 30-minute intraday execution.
Rather than chasing extended breakout moves, this system identifies Stage 2 market leaders undergoing orderly, low-volume consolidations into key dynamic support (Daily 8 & 21 EMA) and automates entry, risk definition, and target projections.
Key Features
30-Minute Tactical Setup Engine:
Tracks constructive pullbacks touching Daily 8 & 21 EMA support levels.
Filters for supply dry-up conditions (low pullback volume / exhaustion).
Automatically tags qualifying setups with chronological badges (SETUP 1, SETUP 2).
Dynamic Risk & Execution Levels:
BUY: Placed at the trigger bar's high.
SL: Anchored to the structural low of the trigger bar, complete with exact price and dynamic risk percentage (Risk %).
T1 (+2R): Dashed line projecting a 2:1 reward-to-risk ratio.
T2 (Swing High): Trailing target anchored to recent 10-day swing highs.
Unified RS Engine with Leading Blue Dots:
Benchmarks price action directly against NSE:CNX500 (or chosen index).
Cyan Circles (Leading RS Dots): Highlights when Relative Strength reaches a 40-bar high before the stock's price breaks out—signaling institutional accumulation.
Blue Circles (Confirmed RS Dots): Flags simultaneous price and RS new highs.
Anchored between the 50 and 150 SMAs directly on the price chart to save vertical pane space.
Daily Metric Dashboard (A+ Setup Auditor):
Evaluates 10 structural metrics on the daily timeframe:
Setup Quality: Automated grading (A+ HEALTHY, MODERATE, TRAP/AVOID) based on duration, volume dry-up, wick rejection, and trend alignment.
Consolidation Duration: Flags ideal 3–8 day digestions vs. stale extensions.
Overhead Supply: Detects upper trap wicks exceeding 40% of the daily candle range.
Liquidity & Float: Classifies float profile based on share count or Rupee turnover.
Volume Buzz & Up/Down Ratio: Measures 50-day accumulation vs. distribution volume.
Intraday ADR% HUD:
Displays real-time 20-day Average Daily Range (ADR%) in the bottom-right corner.
Categorizes market velocity (Fast Leader, Moderate, Slow Range, High Vol / Downtrend) to confirm if the asset has enough daily velocity to reach +2R targets.
How to Use
Daily Screening: Identify Stage 2 market leaders with strong fundamentals and top industry group ranking resting near their rising Daily 8 or 21 EMA.
Setup Identification: Switch to the 30-minute chart. Ensure there is clear overhead space between entry and Target 1 (no descending 50/200 SMAs blocking the runway).
Trigger & Order Entry: When a SETUP badge prints, place a buy-stop at the labeled BUY price and an initial stop-loss at the labeled SL price.
Trade Management: Lock in partial gains at Target 1 (+2R) and trail the remaining position with a breakeven stop toward Target 2 (Swing High).
Credits & Methodology
Special acknowledgment to the momentum trading frameworks shared by Sean (SrxTrades) and @1ChartMaster (Elite Swing Trading), whose tactical moving average pullback setups and execution clarity inspired this Pine Script implementation.
The 30 Min Pivot Pullback Strategy is an execution toolkit designed for momentum and swing traders. Inspired by Mark Minervini's Volatility Contraction Pattern (VCP), William O'Neil's CANSLIM principles, and Patrick Walker's moving average pullback framework, this tool bridges the gap between daily macro trend identification and precise 30-minute intraday execution.
Rather than chasing extended breakout moves, this system identifies Stage 2 market leaders undergoing orderly, low-volume consolidations into key dynamic support (Daily 8 & 21 EMA) and automates entry, risk definition, and target projections.
Key Features
30-Minute Tactical Setup Engine:
Tracks constructive pullbacks touching Daily 8 & 21 EMA support levels.
Filters for supply dry-up conditions (low pullback volume / exhaustion).
Automatically tags qualifying setups with chronological badges (SETUP 1, SETUP 2).
Dynamic Risk & Execution Levels:
BUY: Placed at the trigger bar's high.
SL: Anchored to the structural low of the trigger bar, complete with exact price and dynamic risk percentage (Risk %).
T1 (+2R): Dashed line projecting a 2:1 reward-to-risk ratio.
T2 (Swing High): Trailing target anchored to recent 10-day swing highs.
Unified RS Engine with Leading Blue Dots:
Benchmarks price action directly against NSE:CNX500 (or chosen index).
Cyan Circles (Leading RS Dots): Highlights when Relative Strength reaches a 40-bar high before the stock's price breaks out—signaling institutional accumulation.
Blue Circles (Confirmed RS Dots): Flags simultaneous price and RS new highs.
Anchored between the 50 and 150 SMAs directly on the price chart to save vertical pane space.
Daily Metric Dashboard (A+ Setup Auditor):
Evaluates 10 structural metrics on the daily timeframe:
Setup Quality: Automated grading (A+ HEALTHY, MODERATE, TRAP/AVOID) based on duration, volume dry-up, wick rejection, and trend alignment.
Consolidation Duration: Flags ideal 3–8 day digestions vs. stale extensions.
Overhead Supply: Detects upper trap wicks exceeding 40% of the daily candle range.
Liquidity & Float: Classifies float profile based on share count or Rupee turnover.
Volume Buzz & Up/Down Ratio: Measures 50-day accumulation vs. distribution volume.
Intraday ADR% HUD:
Displays real-time 20-day Average Daily Range (ADR%) in the bottom-right corner.
Categorizes market velocity (Fast Leader, Moderate, Slow Range, High Vol / Downtrend) to confirm if the asset has enough daily velocity to reach +2R targets.
How to Use
Daily Screening: Identify Stage 2 market leaders with strong fundamentals and top industry group ranking resting near their rising Daily 8 or 21 EMA.
Setup Identification: Switch to the 30-minute chart. Ensure there is clear overhead space between entry and Target 1 (no descending 50/200 SMAs blocking the runway).
Trigger & Order Entry: When a SETUP badge prints, place a buy-stop at the labeled BUY price and an initial stop-loss at the labeled SL price.
Trade Management: Lock in partial gains at Target 1 (+2R) and trail the remaining position with a breakeven stop toward Target 2 (Swing High).
Credits & Methodology
Special acknowledgment to the momentum trading frameworks shared by Sean (SrxTrades) and @1ChartMaster (Elite Swing Trading), whose tactical moving average pullback setups and execution clarity inspired this Pine Script implementation.
Catatan Rilis
obust State Machine & Order ManagementAdvanced State Machine: Implemented structured tracking across setups, pending orders, active trades, T1/T2 target milestones, and trailing stops.
Intra-Bar & Gap Protection: Added transient detection for adverse opening gaps and stop-loss breaches at the open (isDeadOnOpenTransient, isGapDownBreachNow), automatically converting unfilled or compromised orders into clean cancellations (CANCEL (GAP RISK), CANCEL (GAP SL), CANCEL (SL BREACH)).
2. Enhanced Relative Strength (RS) & Daily Checklist Integration
Price-Anchored RS Engine: Integrated a normalized RS line comparing performance against benchmark indices (such as CNX500 or Nifty) complete with leading and confirmed RS breakout dots.
Daily Metrics Pipeline: Consolidated multi-timeframe daily data requests (request.security tuple merging) for ATR, volume moving averages, and 52-week highs/lows.
Quality Grading: Added automated setup grading (A+ HEALTHY, MODERATE, TRAP / AVOID) based on consolidation duration, volume dry-up, and overhead supply checks.
3. Position Sizing & Risk Controls
Dynamic Sizing & Risk Management: Linked total portfolio capital and per-trade fixed max risk (maxRiskRs) to automatically calculate accurate order quantities and position sizing.
Breakeven & Trailing Stop Automation: Configured automatic Target 1 hit detection that ratchets the stop loss to breakeven/cost and transitions into a runner trailing stop mechanism referencing either the 30m or Daily 8 EMA.
4. Visual Layout & Dashboard Upgrades
Unified HUD & Market Status Tables: Built a cleaner information hierarchy on the chart displaying order quantities, capital outlays, risk metrics, ADR% status, and a real-time Nifty market status HUD (tracking Opening Range Breakouts, VWAP, and market bias).
Historical Setup Archiving: Implemented UDT-wrapped graphic management (SetupPackage) to cleanly track and limit historical setup drawings on the chart.
Catatan Rilis
nified Graphic Management & Lifecycle Archiving: Implemented a robust SetupPackage architecture using arrays to persistently store and manage historical trade graphics, entry lines, stop levels, targets, and exit badges without rendering orphan lines.Continuous Multi-Stage Trade Tracking: Upgraded trade execution so that intermediate milestones (such as hitting Target 1) trigger partial profit markers and shift stop-losses to breakeven (SL: COST) without prematurely terminating the trade lifecycle, allowing runners to track all the way to Target 2 or dynamic trailing stop exits.
Guaranteed Terminal Outcome Resolution: Ensured that every historical setup package concludes with a definitive termination status (T2 HIT, STOPPED, CANCEL, EXPIRED, or CLOSED), eliminating floating or incomplete setup lines on the chart.
Dynamic Position Sizing & Risk Management: Integrated automated risk calculations based on total portfolio capital and per-trade fixed risk parameters, factoring in gap risk multipliers, order timeouts, and intraday session controls.
Relative Strength & Market Status HUDs: Embedded a multi-timeframe checklist dashboard, price-anchored relative strength (RS) engine with leading breakout dots, Average Daily Range (ADR) velocity metrics, and Nifty opening range breakout (ORB) context tables.
Configurable Historical Display Limit: Expanded the user input range for recentSetupsToKeep (up to 50 historical setups) to allow flexible chart visibility control.
Catatan Rilis
This update introduces major structural refinements and advanced filtering to optimize trend continuation entries on 30-minute charts, reducing setup spam during choppy consolidation while capturing high-conviction momentum waves.1. Core Filter Enhancements
Strict Multi-Bar Pullback Sequence: Enforces a mandatory 2+ consecutive red candle pullback sequence preceding the green reaction candle, eliminating single-bar noise and choppy sideways triggers.
Pullback Cycle Restriction: Added a cycle lock input (Restrict Max Setup Triggers Per Pullback Cycle) set to 1 by default, ensuring that once a setup fires during a pullback wave, subsequent signals are suppressed until the price successfully re-arms (via a new swing high or extension above the daily 8 EMA).
2. Quality Scoring & Leader Filters
Multi-Factor Quality Score ([0/5] to [5/5]): Automatically grades pullbacks based on volume dry-ups, price compression, strong reaction bar closes, 8 EMA alignment, and relative strength (RS) slope.
Leader Filter Integration: Added a customizable threshold (Max % Below 52W High) to filter out lagging stocks and focus strictly on market leaders.
3. Visual & Lifecycle Management
Full Lifecycle Setup Archiving: Historical setups and cancelled/timed-out orders are retained cleanly on the chart using persistent object arrays, allowing you to review performance across extended date ranges (supporting retention limits up to 200 historical packages).
Enhanced Dashboards: Includes a dynamic Higher-Timeframe Checklist Dashboard, Market Status HUD, and ADR% velocity status table for real-time market context.
Catatan Rilis
new changes were added to filter unwanted setups and backtesting now accesible for both US and indian markets added qulaity toggle 
Pernyataan Penyangkalan
Informasi dan publikasi ini tidak dimaksudkan, dan bukan merupakan, saran atau rekomendasi keuangan, investasi, trading, atau jenis lainnya yang diberikan atau didukung oleh TradingView. Baca selengkapnya di Ketentuan Penggunaan.
Pernyataan Penyangkalan
Informasi dan publikasi ini tidak dimaksudkan, dan bukan merupakan, saran atau rekomendasi keuangan, investasi, trading, atau jenis lainnya yang diberikan atau didukung oleh TradingView. Baca selengkapnya di Ketentuan Penggunaan.