OPEN-SOURCE SCRIPT
Liquidation Bubbles [OmegaTools]
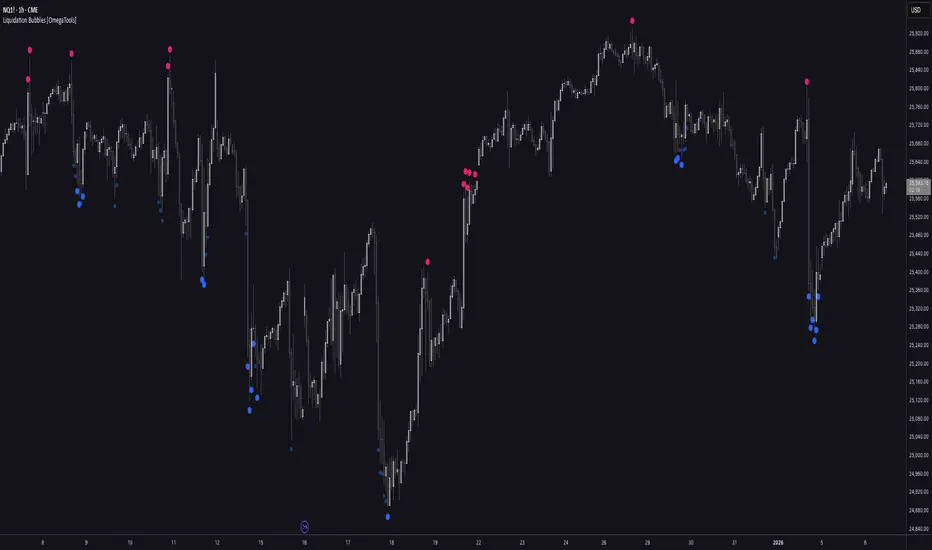
🔴🟢 Liquidation Bubbles — Advanced Volume & Price Stress Detector
Liquidation Bubbles is a professional-grade analytical tool designed to identify forced positioning events, stop-runs, and liquidation clusters by combining price displacement and volume imbalance into a single, statistically normalized framework.
This indicator is not a repainting signal tool and not a simple volume spike detector. It is a contextual market stress mapper, built to highlight areas where one-sided positioning becomes unstable and the probability of forced order execution (liquidations, stops, margin calls) materially increases.
---
## 🔬 Core Concept
Market liquidations do not occur randomly.
They emerge when price deviates aggressively from its volume-weighted equilibrium while volume itself becomes abnormal.
Liquidation Bubbles detects exactly this condition by:
* Estimating a **dynamic equilibrium price** using an *inverted volume-weighted moving average*
* Measuring **directional price stress** relative to that equilibrium
* Measuring **volume stress** relative to its own adaptive baseline
* Normalizing both into **Z-score–like metrics**
* Highlighting only **statistically extreme, asymmetric events**
The result is a clear visual map of stress points where market participants are most vulnerable.
---
⚙️ Methodology (How It Works)
1️⃣ Advanced Inverted VWMA (Equilibrium Engine)
The script uses a custom Advanced VWMA, where:
* High volume bars receive less weight
* Low volume bars receive more weight
This produces a **robust equilibrium level**, resistant to manipulation and volume bursts.
This equilibrium is used for **both price and volume normalization**, creating a consistent statistical framework.
---
2️⃣ Price Stress (Directional)
Price stress is calculated as:
* The **maximum deviation** between high/low and equilibrium
* Directionally signed (upside vs downside)
* Normalized by its own historical volatility
This allows the script to distinguish:
* Aggressive upside exhaustion
* Aggressive downside capitulation
---
3️⃣ Volume Stress
Volume stress is measured as:
* Deviation from volume equilibrium
* Normalized by historical volume dispersion
This filters out:
* Normal high-volume sessions
* Illiquid noise
And isolates abnormal participation imbalance.
---
4️⃣ Liquidation Logic
A liquidation event is flagged when:
* Both price stress and volume stress exceed adaptive thresholds
* The imbalance is directional and statistically extreme
Optional Combined Score Mode allows aggregation of price & volume stress into a single composite metric for smoother signals.
---
🔵 Bubble System (Signal Hierarchy)
The indicator plots **two tiers of bubbles**:
🟢🔴 Small Bubbles
* Early warning stress points
* Localized stop-runs
* Micro-liquidations
* Often precede reactions or short-term reversals
🟢🔴 Big Bubbles
* Full liquidation clusters
* Forced unwinds
* High probability exhaustion zones
* Frequently align with:
* Intraday extremes
* Range boundaries
* Reversal pivots
* Volatility expansions
Bubble color:
* **Green** → Downside liquidation (sell-side exhaustion)
* **Red** → Upside liquidation (buy-side exhaustion)
Bubble placement is **ATR-adjusted**, ensuring visual clarity without overlapping price.
---
🔄 Cross-Market Volume Analysis
The script allows optional **external volume sourcing**, enabling:
* Futures volume applied to CFDs
* Index volume applied to ETFs
* Spot volume applied to derivatives
This is critical when:
* Your traded instrument has unreliable volume
* You want **institutional-grade confirmation**
---
🧠 How to Use Liquidation Bubbles
This indicator is **not meant to be traded alone**.
Best use cases:
* 🔹 Confluence with support & resistance
* 🔹 Contextual confirmation for reversals
* 🔹 Identifying fake breakouts
* 🔹 Liquidity sweep detection
* 🔹 Risk management (avoid entering into liquidation zones)
Ideal for:
* Futures
* Indices
* Crypto
* High-liquidity FX pairs
* Intraday & swing trading
---
🎯 Who This Tool Is For
Liquidation Bubbles is designed for:
* Advanced discretionary traders
* Order-flow & liquidity-based traders
* Macro & index traders
* Professionals seeking **context**, not signals
If you want **where the market is fragile**, not just where price moved — this tool was built for you.
---
📌 Key Characteristics
✔ Non-repainting
✔ Statistically normalized
✔ Adaptive to volatility
✔ Works on all timeframes
✔ Futures & crypto ready
✔ No lagging indicators
✔ No moving average crosses
---
Liquidation Bubbles does not predict the future.
It shows you where the market is most likely to break.
— OmegaTools
Liquidation Bubbles is a professional-grade analytical tool designed to identify forced positioning events, stop-runs, and liquidation clusters by combining price displacement and volume imbalance into a single, statistically normalized framework.
This indicator is not a repainting signal tool and not a simple volume spike detector. It is a contextual market stress mapper, built to highlight areas where one-sided positioning becomes unstable and the probability of forced order execution (liquidations, stops, margin calls) materially increases.
---
## 🔬 Core Concept
Market liquidations do not occur randomly.
They emerge when price deviates aggressively from its volume-weighted equilibrium while volume itself becomes abnormal.
Liquidation Bubbles detects exactly this condition by:
* Estimating a **dynamic equilibrium price** using an *inverted volume-weighted moving average*
* Measuring **directional price stress** relative to that equilibrium
* Measuring **volume stress** relative to its own adaptive baseline
* Normalizing both into **Z-score–like metrics**
* Highlighting only **statistically extreme, asymmetric events**
The result is a clear visual map of stress points where market participants are most vulnerable.
---
⚙️ Methodology (How It Works)
1️⃣ Advanced Inverted VWMA (Equilibrium Engine)
The script uses a custom Advanced VWMA, where:
* High volume bars receive less weight
* Low volume bars receive more weight
This produces a **robust equilibrium level**, resistant to manipulation and volume bursts.
This equilibrium is used for **both price and volume normalization**, creating a consistent statistical framework.
---
2️⃣ Price Stress (Directional)
Price stress is calculated as:
* The **maximum deviation** between high/low and equilibrium
* Directionally signed (upside vs downside)
* Normalized by its own historical volatility
This allows the script to distinguish:
* Aggressive upside exhaustion
* Aggressive downside capitulation
---
3️⃣ Volume Stress
Volume stress is measured as:
* Deviation from volume equilibrium
* Normalized by historical volume dispersion
This filters out:
* Normal high-volume sessions
* Illiquid noise
And isolates abnormal participation imbalance.
---
4️⃣ Liquidation Logic
A liquidation event is flagged when:
* Both price stress and volume stress exceed adaptive thresholds
* The imbalance is directional and statistically extreme
Optional Combined Score Mode allows aggregation of price & volume stress into a single composite metric for smoother signals.
---
🔵 Bubble System (Signal Hierarchy)
The indicator plots **two tiers of bubbles**:
🟢🔴 Small Bubbles
* Early warning stress points
* Localized stop-runs
* Micro-liquidations
* Often precede reactions or short-term reversals
🟢🔴 Big Bubbles
* Full liquidation clusters
* Forced unwinds
* High probability exhaustion zones
* Frequently align with:
* Intraday extremes
* Range boundaries
* Reversal pivots
* Volatility expansions
Bubble color:
* **Green** → Downside liquidation (sell-side exhaustion)
* **Red** → Upside liquidation (buy-side exhaustion)
Bubble placement is **ATR-adjusted**, ensuring visual clarity without overlapping price.
---
🔄 Cross-Market Volume Analysis
The script allows optional **external volume sourcing**, enabling:
* Futures volume applied to CFDs
* Index volume applied to ETFs
* Spot volume applied to derivatives
This is critical when:
* Your traded instrument has unreliable volume
* You want **institutional-grade confirmation**
---
🧠 How to Use Liquidation Bubbles
This indicator is **not meant to be traded alone**.
Best use cases:
* 🔹 Confluence with support & resistance
* 🔹 Contextual confirmation for reversals
* 🔹 Identifying fake breakouts
* 🔹 Liquidity sweep detection
* 🔹 Risk management (avoid entering into liquidation zones)
Ideal for:
* Futures
* Indices
* Crypto
* High-liquidity FX pairs
* Intraday & swing trading
---
🎯 Who This Tool Is For
Liquidation Bubbles is designed for:
* Advanced discretionary traders
* Order-flow & liquidity-based traders
* Macro & index traders
* Professionals seeking **context**, not signals
If you want **where the market is fragile**, not just where price moved — this tool was built for you.
---
📌 Key Characteristics
✔ Non-repainting
✔ Statistically normalized
✔ Adaptive to volatility
✔ Works on all timeframes
✔ Futures & crypto ready
✔ No lagging indicators
✔ No moving average crosses
---
Liquidation Bubbles does not predict the future.
It shows you where the market is most likely to break.
— OmegaTools
Skrip open-source
Dengan semangat TradingView yang sesungguhnya, pembuat skrip ini telah menjadikannya sebagai sumber terbuka, sehingga para trader dapat meninjau dan memverifikasi fungsinya. Salut untuk penulisnya! Meskipun Anda dapat menggunakannya secara gratis, perlu diingat bahwa penerbitan ulang kode ini tunduk pada Tata Tertib kami.

Pernyataan Penyangkalan
Informasi dan publikasi ini tidak dimaksudkan, dan bukan merupakan, saran atau rekomendasi keuangan, investasi, trading, atau jenis lainnya yang diberikan atau didukung oleh TradingView. Baca selengkapnya di Ketentuan Penggunaan.
Skrip open-source
Dengan semangat TradingView yang sesungguhnya, pembuat skrip ini telah menjadikannya sebagai sumber terbuka, sehingga para trader dapat meninjau dan memverifikasi fungsinya. Salut untuk penulisnya! Meskipun Anda dapat menggunakannya secara gratis, perlu diingat bahwa penerbitan ulang kode ini tunduk pada Tata Tertib kami.
Pernyataan Penyangkalan
Informasi dan publikasi ini tidak dimaksudkan, dan bukan merupakan, saran atau rekomendasi keuangan, investasi, trading, atau jenis lainnya yang diberikan atau didukung oleh TradingView. Baca selengkapnya di Ketentuan Penggunaan.