OPEN-SOURCE SCRIPT
Regression X [Clever]
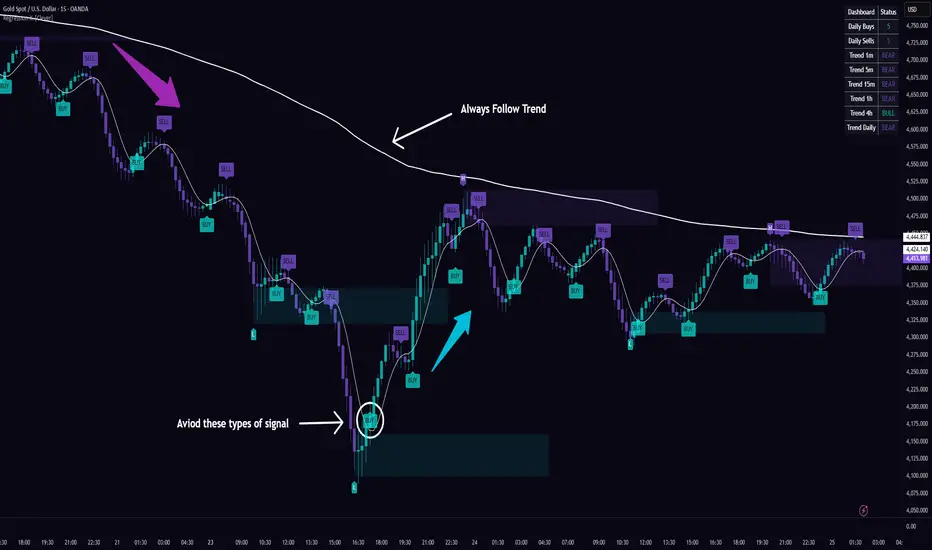
📊 Indicator Overview — Regression X [Clever]
Regression X [Clever] is a multi-component technical analysis indicator designed to provide a structured and smoothed view of price action using linear regression calculations. By replacing traditional candlesticks with regression-derived OHLC values, the script aims to reduce short-term price noise and present a clearer representation of underlying market direction.
The indicator integrates several analytical elements—including a signal line, long-term trend reference, pivot-based structure detection, automatic support and resistance zones, alert conditions, and a multi-timeframe dashboard—into a single charting tool. These components are designed to assist users in observing price behavior, identifying potential trend shifts, and monitoring key structural levels.
🔍 Detailed Feature Breakdown
1️⃣ Linear Regression Candle Construction
The script computes linear regression values for open, high, low, and close over a user-defined length
These values are used to plot custom candles instead of standard price candles
This approach smooths fluctuations and helps highlight directional bias
Candle color is determined by:
Bullish condition: regression close ≥ regression open
Bearish condition: regression close < regression open
Wick and body colors are unified for visual consistency
2️⃣ Signal Line (Smoothed Reference)
A Simple Moving Average (SMA) is applied to the regression close values
Acts as a smoothing layer to help interpret short-term directional changes
Can be toggled on/off depending on user preference
Customizable smoothing length
3️⃣ Exponential Moving Average (EMA) Reference
Includes a configurable EMA (default length: 200) plotted on the chart
Provides a commonly used reference for broader market direction
Independent of regression calculations (based on standard close price)
Customizable color and length
4️⃣ Signal Generation Logic
The script identifies crossover events between:
Regression close and the signal line
Conditions:
Buy Signal: regression close crosses above the signal line
Sell Signal: regression close crosses below the signal line
Signals are displayed using labeled markers on the chart
Signal text and colors are customizable
5️⃣ Pivot-Based High/Low Detection
Uses left/right bar lookback logic to identify:
Pivot Highs (swing highs)
Pivot Lows (swing lows)
Helps visualize local price structure
Pivot labels (H/L) are plotted with offset to align with confirmed pivots
Feature can be enabled or disabled
6️⃣ Automatic Support and Resistance Zones
Support and resistance zones are derived from detected pivot points
Each zone is drawn using box elements:
Resistance zones: based on pivot highs
Support zones: based on pivot lows
Zone properties:
Adjustable transparency
Configurable maximum number of zones to display
Optional extension to the right (dynamic zones)
Fixed-width zones when extension is disabled
Older zones are automatically removed once the defined limit is exceeded
Zones are anchored to the price range of the pivot candle
7️⃣ Alert Conditions
Built-in alert triggers for:
Buy signal (crossover event)
Sell signal (crossunder event)
Alerts can be configured through TradingView’s alert system
Designed for notification purposes only
8️⃣ Multi-Timeframe (MTF) Trend Dashboard
Displays trend direction across multiple timeframes using regression logic:
1 minute
5 minutes
15 minutes
1 hour
4 hours
Daily
For each timeframe:
Compares regression close vs regression open
Displays:
BULL → upward bias
BEAR → downward bias
Data is requested using request.security for cross-timeframe analysis
9️⃣ Daily Signal Tracking
Tracks the number of:
Buy signals generated during the current day
Sell signals generated during the current day
Counters automatically reset at the start of a new trading day
Useful for monitoring signal frequency
🔟 On-Chart Dashboard Table
A table is displayed in the top-right corner of the chart
Includes:
Indicator title header
Daily buy/sell counts
Multi-timeframe trend status
Table styling:
Customizable text size
Background transparency
Color-coded trend labels
🎨 Customization and Inputs
Users can configure multiple aspects of the indicator, including:
Linear regression length
Signal smoothing length
EMA length and color
Candle colors (bullish/bearish)
Signal label colors
Pivot detection parameters
Support/resistance zone behavior:
Transparency
Width
Extension
Maximum zone count
Dashboard table size
⚠️ Disclaimer
This script is provided for educational and informational purposes only. It is not intended as financial, investment, or trading advice.
All calculations and signals are derived from historical price data and mathematical formulas. As such, they do not guarantee future results or performance. Market conditions can change, and no indicator can fully account for all variables involved in trading.
Users are responsible for conducting their own analysis and risk management. This script should be used as a supplementary tool and not as the sole basis for making trading decisions. The author assumes no responsibility for any losses or damages incurred from the use of this indicator.
Regression X [Clever] is a multi-component technical analysis indicator designed to provide a structured and smoothed view of price action using linear regression calculations. By replacing traditional candlesticks with regression-derived OHLC values, the script aims to reduce short-term price noise and present a clearer representation of underlying market direction.
The indicator integrates several analytical elements—including a signal line, long-term trend reference, pivot-based structure detection, automatic support and resistance zones, alert conditions, and a multi-timeframe dashboard—into a single charting tool. These components are designed to assist users in observing price behavior, identifying potential trend shifts, and monitoring key structural levels.
🔍 Detailed Feature Breakdown
1️⃣ Linear Regression Candle Construction
The script computes linear regression values for open, high, low, and close over a user-defined length
These values are used to plot custom candles instead of standard price candles
This approach smooths fluctuations and helps highlight directional bias
Candle color is determined by:
Bullish condition: regression close ≥ regression open
Bearish condition: regression close < regression open
Wick and body colors are unified for visual consistency
2️⃣ Signal Line (Smoothed Reference)
A Simple Moving Average (SMA) is applied to the regression close values
Acts as a smoothing layer to help interpret short-term directional changes
Can be toggled on/off depending on user preference
Customizable smoothing length
3️⃣ Exponential Moving Average (EMA) Reference
Includes a configurable EMA (default length: 200) plotted on the chart
Provides a commonly used reference for broader market direction
Independent of regression calculations (based on standard close price)
Customizable color and length
4️⃣ Signal Generation Logic
The script identifies crossover events between:
Regression close and the signal line
Conditions:
Buy Signal: regression close crosses above the signal line
Sell Signal: regression close crosses below the signal line
Signals are displayed using labeled markers on the chart
Signal text and colors are customizable
5️⃣ Pivot-Based High/Low Detection
Uses left/right bar lookback logic to identify:
Pivot Highs (swing highs)
Pivot Lows (swing lows)
Helps visualize local price structure
Pivot labels (H/L) are plotted with offset to align with confirmed pivots
Feature can be enabled or disabled
6️⃣ Automatic Support and Resistance Zones
Support and resistance zones are derived from detected pivot points
Each zone is drawn using box elements:
Resistance zones: based on pivot highs
Support zones: based on pivot lows
Zone properties:
Adjustable transparency
Configurable maximum number of zones to display
Optional extension to the right (dynamic zones)
Fixed-width zones when extension is disabled
Older zones are automatically removed once the defined limit is exceeded
Zones are anchored to the price range of the pivot candle
7️⃣ Alert Conditions
Built-in alert triggers for:
Buy signal (crossover event)
Sell signal (crossunder event)
Alerts can be configured through TradingView’s alert system
Designed for notification purposes only
8️⃣ Multi-Timeframe (MTF) Trend Dashboard
Displays trend direction across multiple timeframes using regression logic:
1 minute
5 minutes
15 minutes
1 hour
4 hours
Daily
For each timeframe:
Compares regression close vs regression open
Displays:
BULL → upward bias
BEAR → downward bias
Data is requested using request.security for cross-timeframe analysis
9️⃣ Daily Signal Tracking
Tracks the number of:
Buy signals generated during the current day
Sell signals generated during the current day
Counters automatically reset at the start of a new trading day
Useful for monitoring signal frequency
🔟 On-Chart Dashboard Table
A table is displayed in the top-right corner of the chart
Includes:
Indicator title header
Daily buy/sell counts
Multi-timeframe trend status
Table styling:
Customizable text size
Background transparency
Color-coded trend labels
🎨 Customization and Inputs
Users can configure multiple aspects of the indicator, including:
Linear regression length
Signal smoothing length
EMA length and color
Candle colors (bullish/bearish)
Signal label colors
Pivot detection parameters
Support/resistance zone behavior:
Transparency
Width
Extension
Maximum zone count
Dashboard table size
⚠️ Disclaimer
This script is provided for educational and informational purposes only. It is not intended as financial, investment, or trading advice.
All calculations and signals are derived from historical price data and mathematical formulas. As such, they do not guarantee future results or performance. Market conditions can change, and no indicator can fully account for all variables involved in trading.
Users are responsible for conducting their own analysis and risk management. This script should be used as a supplementary tool and not as the sole basis for making trading decisions. The author assumes no responsibility for any losses or damages incurred from the use of this indicator.
Skrip open-source
Dengan semangat TradingView yang sesungguhnya, pembuat skrip ini telah menjadikannya sebagai sumber terbuka, sehingga para trader dapat meninjau dan memverifikasi fungsinya. Salut untuk penulisnya! Meskipun Anda dapat menggunakannya secara gratis, perlu diingat bahwa penerbitan ulang kode ini tunduk pada Tata Tertib kami.

Pernyataan Penyangkalan
Informasi dan publikasi ini tidak dimaksudkan, dan bukan merupakan, saran atau rekomendasi keuangan, investasi, trading, atau jenis lainnya yang diberikan atau didukung oleh TradingView. Baca selengkapnya di Ketentuan Penggunaan.
Skrip open-source
Dengan semangat TradingView yang sesungguhnya, pembuat skrip ini telah menjadikannya sebagai sumber terbuka, sehingga para trader dapat meninjau dan memverifikasi fungsinya. Salut untuk penulisnya! Meskipun Anda dapat menggunakannya secara gratis, perlu diingat bahwa penerbitan ulang kode ini tunduk pada Tata Tertib kami.
Pernyataan Penyangkalan
Informasi dan publikasi ini tidak dimaksudkan, dan bukan merupakan, saran atau rekomendasi keuangan, investasi, trading, atau jenis lainnya yang diberikan atau didukung oleh TradingView. Baca selengkapnya di Ketentuan Penggunaan.