OPEN-SOURCE SCRIPT
Diupdate Phase Entropy Oscillator [LliterH]
█ OVERVIEW
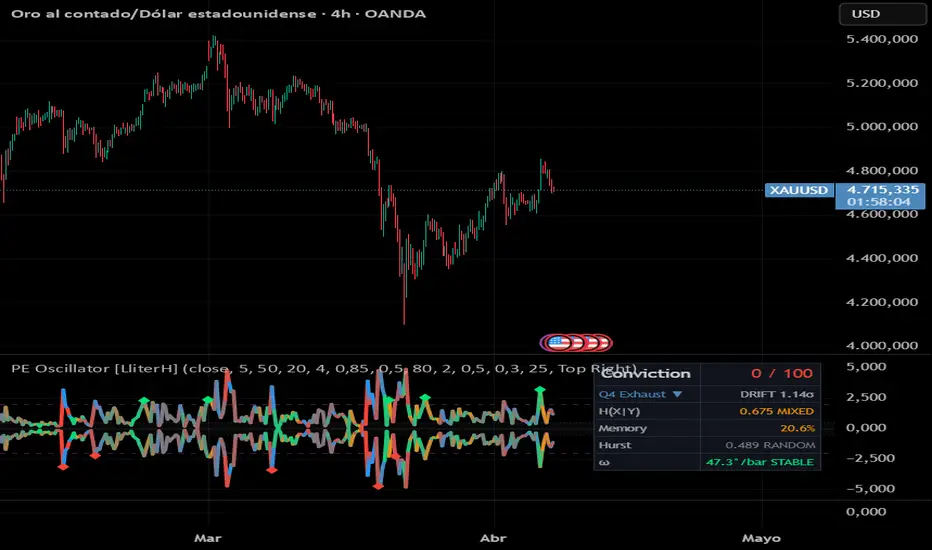
The Phase Entropy Oscillator fuses five layers of applied mathematics — Phase Space dynamics, Conditional Shannon Entropy, the Hurst Exponent, Angular Velocity, and a multiplicative Conviction Score — into a single analytical framework.
It answers three questions no traditional oscillator addresses:
1. What is the market DOING? (Impulse or Exhaustion?)
2. Should I TRUST it? (Information or Noise?)
3. Will the current behavior PERSIST? (Trending or Mean-Reverting?)
Most oscillators measure magnitude: "how overbought" or "how oversold." This one measures the physics of price movement, the statistical quality of that movement, and whether the market has exploitable memory. The result is an oscillator that literally fades itself to gray when the math says "don't trust this."
█ THE MATHEMATICS
🌀 Pillar 1 — Phase Space (Classical Mechanics)
In physics, a system's state is fully described by its position and velocity. Plotting velocity against acceleration creates a "phase portrait" — a map of the system's dynamics independent of time.
Applied to price:
• Velocity = first derivative of smoothed price (rate of change)
• Acceleration = second derivative (rate of change of velocity)
• Both are z-score normalized for cross-instrument comparability
The phase portrait decomposes price action into four quadrants:
Q1 (+vel, +acc) → IMPULSE UP Rising and speeding up
Q2 (+vel, −acc) → EXHAUSTION UP Rising but decelerating
Q3 (−vel, −acc) → IMPULSE DOWN Falling and speeding up
Q4 (−vel, +acc) → EXHAUSTION DOWN Falling but decelerating
Key insight: most retail traders enter during Q2 or Q4 (exhaustion — "chasing the move"). The phase portrait exposes this by showing that acceleration has already reversed while price still moves in the original direction.
Phase Magnitude = sqrt(vel² + acc²) — the distance from the origin. Three regimes:
• ORBIT (low magnitude) → near attractor = ranging
• DRIFT (medium) → transitional
• ESCAPE (high magnitude) → leaving attractor = breakout
🔬 Pillar 2 — Conditional Shannon Entropy (Information Theory)
Standard Shannon Entropy H(X) measures total uncertainty. This indicator computes CONDITIONAL entropy H(X|Y) — uncertainty of the current return GIVEN the previous return.
Implementation: a bins × bins transition matrix T[current_bin, previous_bin] captures the Markov structure of price returns:
Pine Script® → marginal uncertainty
Pine Script® → conditional uncertainty
The Entropy Rate Ratio R = H(X|Y) / H(X) reveals market memory:
R → 1 : memoryless — past doesn't help
R → 0 : strong memory — past predicts future
Memory Strength = 1 − R, displayed as percentage.
This is, to our knowledge, the first TradingView indicator to compute conditional entropy with a transition matrix.
Integration: conditional entropy modulates the COLOR of all phase elements. High entropy → gray. Low entropy → vivid colors. The indicator displays its own confidence.
📐 Pillar 3 — Multi-Scale Hurst Exponent (Fractal Analysis)
H > 0.5 → persistent (trending)
H = 0.5 → random walk (no memory)
H < 0.5 → anti-persistent (mean-reverting)
Uses multi-scale R/S analysis (Mandelbrot & Wallis, 1969):
1. Four scales: n, n/2, n/4, n/8
2. Non-overlapping segments per scale
3. R/S averaged per scale
4. Linear regression of log(R/S) vs log(scale)
5. Slope = Hurst exponent
🌀 Pillar 4 — Angular Velocity (ω)
ω = |Δθ/Δt| where θ = atan2(acc, vel). Measures how fast the system rotates between quadrants:
CHOPPY (z > 1.0) → rapid rotation = whipsaw
STABLE (z < −0.5) → sustained direction = real trend
High magnitude + STABLE = strong breakout.
High magnitude + CHOPPY = false escape.
📊 Pillar 5 — Multiplicative Conviction Score
Conviction = (Magnitude × Entropy × Hurst × Angular × Memory) ^ (1/5) × 100
Geometric mean enforces AND logic: ALL must confirm. One weak factor drags everything down.
█ FEATURES
• Phase magnitude oscillator (± mirror) colored by quadrant × entropy
• Four-quadrant classification with entropy-modulated coloring
• Three phase regimes: ESCAPE / DRIFT / ORBIT
• Conditional entropy with transition matrix + Memory Strength
• Multi-scale Hurst via R/S regression (4 scales)
• Angular velocity with CHOPPY/STABLE classification
• Multiplicative Conviction Score (0–100)
• Per-quadrant colored trajectory trail
• Triple-confirmed escape markers (entropy + Hurst + angular)
• Detail Mode toggle for velocity/acceleration lines
• Clean 6-row dashboard with all metrics
• Candle coloring by phase quadrant × entropy
█ HOW TO READ IT
Default view shows two elements:
1. THE MAGNITUDE (thick colored ± lines)
How far the system is from equilibrium. Inside gray zone = ranging. Beyond dashed lines = breakout. The COLOR tells you the quadrant (green/red = impulse, orange/blue = exhaustion). GRAY means entropy is high — don't trust it.
2. THE TRAIL (colored segments behind magnitude)
Each segment colored by its bar's quadrant. Tight segments near zero = range. Expanding outward = trend. Color changes along trail = quadrant transitions.
For advanced analysis, enable "Detail Mode" to see velocity and acceleration z-score lines.
█ YOUR STATISTICAL EDGE — HOW TO USE IT
This indicator does not generate buy/sell signals. It gives you something more valuable: it tells you WHEN your signals have statistical backing, and WHEN they don't.
Here is the decision framework:
─── BEFORE ENTERING A TRADE ───
Ask: "Does the environment favor my signal?"
✅ ENTER when:
• Conviction > 50
• Quadrant is Q1 (long) or Q3 (short) — the move is ACCELERATING
• H(X|Y) shows ORDER or MIXED (not NOISE)
• Memory > 20% — the market has exploitable structure
• Hurst shows PERSIST — trend continuation is statistically favored
• ω shows STABLE — trajectory is sustained, not whipping around
⛔ SKIP when:
• Conviction < 20 — all five layers say "no edge"
• H(X|Y) shows NOISE — you are trading a coin flip
• Quadrant is Q2 or Q4 — you are chasing an exhaustion move
• Hurst shows REVERT — breakouts will likely fail
• ω shows CHOPPY — high whipsaw probability
─── WHILE IN A TRADE ───
🔄 Watch for quadrant transitions:
• Q1 → Q2 (impulse → exhaustion up): tighten stop or take partial
• Q3 → Q4 (impulse → exhaustion down): tighten stop or take partial
• Magnitude dropping back into ORBIT zone: the move is over
⚠️ Watch Memory dropping below 10%:
The market is losing its predictable structure. Reduce exposure.
─── PRACTICAL EXAMPLES ───
SCENARIO A — London Session Open, GBP/USD M15:
Your price action setup gives a long signal.
Dashboard: Conviction 72, Q1 Impulse, ESCAPE 2.4σ, ORDER, Memory 38%, PERSIST, STABLE.
→ ALL five layers confirm. Execute with full position size.
SCENARIO B — Same setup, different day:
Dashboard: Conviction 11, Q4 Exhaust, ORBIT 0.3σ, NOISE, Memory 8%, RANDOM, CHOPPY.
→ The market is a coin flip with no memory. Skip.
SCENARIO C — You're already long, price is rising:
Dashboard shifts from Q1 to Q2. Magnitude starts dropping toward orbit zone.
→ The acceleration has reversed. Price still rising but losing energy. Take partial profits.
The edge is not in the indicator predicting direction. The edge is in NOT TRADING when the statistical environment is unfavorable. Most traders lose money during NOISE + CHOPPY + RANDOM regimes. This tool keeps you out of those conditions.
█ UX DESIGN PRINCIPLES
This indicator follows three design principles:
1. Progressive Disclosure (Edward Tufte, "The Visual Display of Quantitative Information", 1983)
Default view is minimal: magnitude + trail + dashboard. Detail Mode reveals velocity/acceleration lines. The user sees only what they need, when they need it.
2. Data-Ink Ratio (Tufte, 1983)
Every visual element carries information. Entropy and Hurst are in the dashboard, not plotted — their [0,1] scale would be crushed against magnitude's [0,4+] range, creating noise without insight.
3. Confidence-Modulated Display
The indicator fades its own colors to gray when entropy says the data is unreliable. This is "honest visualization" — the tool communicates its own limitations in real time, preventing overconfidence.
█ PARAMETERS
Phase Space:
• Source (default: close)
• Derivative Smoothing (default: 5)
• Normalization Window (default: 50)
Shannon Entropy:
• Entropy Window (default: 20) — must be ≥ bins²
• Distribution Bins (default: 4) — matrix = bins² cells
• Noise Threshold (default: 0.85)
• Trend Threshold (default: 0.50)
Hurst Exponent:
• Hurst Window (default: 80) — 4 sub-scales internally
Phase Thresholds:
• Escape (default: 2.0σ)
• Orbit (default: 0.5σ)
• Min Confidence for Markers (default: 0.3)
Trail:
• Show Trail (default: on)
• Trail Length (default: 25 bars)
Visualization:
• Detail Mode (default: off) — shows vel/acc lines
• Color Candles (default: on)
█ RECOMMENDED USAGE
• Liquid instruments: Forex majors, indices, Gold, large-cap crypto
• Timeframes: M15–H4 intraday, D1 swing
• Not a standalone system — it qualifies your signals
█ PERFORMANCE NOTES
Optimizations applied:
• var array reuse (zero allocation per bar)
• Merged R/S passes (2 instead of 3)
• Pre-computed constants (LOG2, PI, DEG_CONV)
• Unrolled Hurst scales (no array overhead)
• Trail only on last bar
Reduce Hurst Window from 80 to 60 if performance warnings appear.
█ ACKNOWLEDGEMENTS
• Phase Space: classical mechanics and dynamical systems theory
• Shannon Entropy: Claude E. Shannon (1948)
• Conditional Entropy: information-theoretic Markov chain analysis
• Hurst Exponent: Benoit Mandelbrot & James Wallis (1969)
• UX Design: Edward Tufte, "The Visual Display of Quantitative Information" (1983)
• The integration of conditional entropy with phase space — making an indicator modulate its own display based on statistical confidence — is original to this publication
█ WHAT THIS INDICATOR IS NOT
• NOT a buy/sell signal generator
• NOT a predictor of future direction
• NOT a replacement for your system — it qualifies it
• NOT for non-standard charts (Heikin Ashi, Renko)
• All readings are inherently lagging
• Conviction Score is a confluence filter, not a backtested edge
█ DISCLAIMER
This indicator is provided for educational and informational purposes only. It does not constitute financial, investment, or trading advice. Past performance is not indicative of future results. Trading involves substantial risk of loss and is not suitable for every investor. Always conduct your own research and consult a qualified financial professional before making any trading decisions. The author is not responsible for any losses incurred from the use of this tool.
The Phase Entropy Oscillator fuses five layers of applied mathematics — Phase Space dynamics, Conditional Shannon Entropy, the Hurst Exponent, Angular Velocity, and a multiplicative Conviction Score — into a single analytical framework.
It answers three questions no traditional oscillator addresses:
1. What is the market DOING? (Impulse or Exhaustion?)
2. Should I TRUST it? (Information or Noise?)
3. Will the current behavior PERSIST? (Trending or Mean-Reverting?)
Most oscillators measure magnitude: "how overbought" or "how oversold." This one measures the physics of price movement, the statistical quality of that movement, and whether the market has exploitable memory. The result is an oscillator that literally fades itself to gray when the math says "don't trust this."
█ THE MATHEMATICS
🌀 Pillar 1 — Phase Space (Classical Mechanics)
In physics, a system's state is fully described by its position and velocity. Plotting velocity against acceleration creates a "phase portrait" — a map of the system's dynamics independent of time.
Applied to price:
• Velocity = first derivative of smoothed price (rate of change)
• Acceleration = second derivative (rate of change of velocity)
• Both are z-score normalized for cross-instrument comparability
The phase portrait decomposes price action into four quadrants:
Q1 (+vel, +acc) → IMPULSE UP Rising and speeding up
Q2 (+vel, −acc) → EXHAUSTION UP Rising but decelerating
Q3 (−vel, −acc) → IMPULSE DOWN Falling and speeding up
Q4 (−vel, +acc) → EXHAUSTION DOWN Falling but decelerating
Key insight: most retail traders enter during Q2 or Q4 (exhaustion — "chasing the move"). The phase portrait exposes this by showing that acceleration has already reversed while price still moves in the original direction.
Phase Magnitude = sqrt(vel² + acc²) — the distance from the origin. Three regimes:
• ORBIT (low magnitude) → near attractor = ranging
• DRIFT (medium) → transitional
• ESCAPE (high magnitude) → leaving attractor = breakout
🔬 Pillar 2 — Conditional Shannon Entropy (Information Theory)
Standard Shannon Entropy H(X) measures total uncertainty. This indicator computes CONDITIONAL entropy H(X|Y) — uncertainty of the current return GIVEN the previous return.
Implementation: a bins × bins transition matrix T[current_bin, previous_bin] captures the Markov structure of price returns:
The Entropy Rate Ratio R = H(X|Y) / H(X) reveals market memory:
R → 1 : memoryless — past doesn't help
R → 0 : strong memory — past predicts future
Memory Strength = 1 − R, displayed as percentage.
This is, to our knowledge, the first TradingView indicator to compute conditional entropy with a transition matrix.
Integration: conditional entropy modulates the COLOR of all phase elements. High entropy → gray. Low entropy → vivid colors. The indicator displays its own confidence.
📐 Pillar 3 — Multi-Scale Hurst Exponent (Fractal Analysis)
H > 0.5 → persistent (trending)
H = 0.5 → random walk (no memory)
H < 0.5 → anti-persistent (mean-reverting)
Uses multi-scale R/S analysis (Mandelbrot & Wallis, 1969):
1. Four scales: n, n/2, n/4, n/8
2. Non-overlapping segments per scale
3. R/S averaged per scale
4. Linear regression of log(R/S) vs log(scale)
5. Slope = Hurst exponent
🌀 Pillar 4 — Angular Velocity (ω)
ω = |Δθ/Δt| where θ = atan2(acc, vel). Measures how fast the system rotates between quadrants:
CHOPPY (z > 1.0) → rapid rotation = whipsaw
STABLE (z < −0.5) → sustained direction = real trend
High magnitude + STABLE = strong breakout.
High magnitude + CHOPPY = false escape.
📊 Pillar 5 — Multiplicative Conviction Score
Conviction = (Magnitude × Entropy × Hurst × Angular × Memory) ^ (1/5) × 100
Geometric mean enforces AND logic: ALL must confirm. One weak factor drags everything down.
█ FEATURES
• Phase magnitude oscillator (± mirror) colored by quadrant × entropy
• Four-quadrant classification with entropy-modulated coloring
• Three phase regimes: ESCAPE / DRIFT / ORBIT
• Conditional entropy with transition matrix + Memory Strength
• Multi-scale Hurst via R/S regression (4 scales)
• Angular velocity with CHOPPY/STABLE classification
• Multiplicative Conviction Score (0–100)
• Per-quadrant colored trajectory trail
• Triple-confirmed escape markers (entropy + Hurst + angular)
• Detail Mode toggle for velocity/acceleration lines
• Clean 6-row dashboard with all metrics
• Candle coloring by phase quadrant × entropy
█ HOW TO READ IT
Default view shows two elements:
1. THE MAGNITUDE (thick colored ± lines)
How far the system is from equilibrium. Inside gray zone = ranging. Beyond dashed lines = breakout. The COLOR tells you the quadrant (green/red = impulse, orange/blue = exhaustion). GRAY means entropy is high — don't trust it.
2. THE TRAIL (colored segments behind magnitude)
Each segment colored by its bar's quadrant. Tight segments near zero = range. Expanding outward = trend. Color changes along trail = quadrant transitions.
For advanced analysis, enable "Detail Mode" to see velocity and acceleration z-score lines.
█ YOUR STATISTICAL EDGE — HOW TO USE IT
This indicator does not generate buy/sell signals. It gives you something more valuable: it tells you WHEN your signals have statistical backing, and WHEN they don't.
Here is the decision framework:
─── BEFORE ENTERING A TRADE ───
Ask: "Does the environment favor my signal?"
✅ ENTER when:
• Conviction > 50
• Quadrant is Q1 (long) or Q3 (short) — the move is ACCELERATING
• H(X|Y) shows ORDER or MIXED (not NOISE)
• Memory > 20% — the market has exploitable structure
• Hurst shows PERSIST — trend continuation is statistically favored
• ω shows STABLE — trajectory is sustained, not whipping around
⛔ SKIP when:
• Conviction < 20 — all five layers say "no edge"
• H(X|Y) shows NOISE — you are trading a coin flip
• Quadrant is Q2 or Q4 — you are chasing an exhaustion move
• Hurst shows REVERT — breakouts will likely fail
• ω shows CHOPPY — high whipsaw probability
─── WHILE IN A TRADE ───
🔄 Watch for quadrant transitions:
• Q1 → Q2 (impulse → exhaustion up): tighten stop or take partial
• Q3 → Q4 (impulse → exhaustion down): tighten stop or take partial
• Magnitude dropping back into ORBIT zone: the move is over
⚠️ Watch Memory dropping below 10%:
The market is losing its predictable structure. Reduce exposure.
─── PRACTICAL EXAMPLES ───
SCENARIO A — London Session Open, GBP/USD M15:
Your price action setup gives a long signal.
Dashboard: Conviction 72, Q1 Impulse, ESCAPE 2.4σ, ORDER, Memory 38%, PERSIST, STABLE.
→ ALL five layers confirm. Execute with full position size.
SCENARIO B — Same setup, different day:
Dashboard: Conviction 11, Q4 Exhaust, ORBIT 0.3σ, NOISE, Memory 8%, RANDOM, CHOPPY.
→ The market is a coin flip with no memory. Skip.
SCENARIO C — You're already long, price is rising:
Dashboard shifts from Q1 to Q2. Magnitude starts dropping toward orbit zone.
→ The acceleration has reversed. Price still rising but losing energy. Take partial profits.
The edge is not in the indicator predicting direction. The edge is in NOT TRADING when the statistical environment is unfavorable. Most traders lose money during NOISE + CHOPPY + RANDOM regimes. This tool keeps you out of those conditions.
█ UX DESIGN PRINCIPLES
This indicator follows three design principles:
1. Progressive Disclosure (Edward Tufte, "The Visual Display of Quantitative Information", 1983)
Default view is minimal: magnitude + trail + dashboard. Detail Mode reveals velocity/acceleration lines. The user sees only what they need, when they need it.
2. Data-Ink Ratio (Tufte, 1983)
Every visual element carries information. Entropy and Hurst are in the dashboard, not plotted — their [0,1] scale would be crushed against magnitude's [0,4+] range, creating noise without insight.
3. Confidence-Modulated Display
The indicator fades its own colors to gray when entropy says the data is unreliable. This is "honest visualization" — the tool communicates its own limitations in real time, preventing overconfidence.
█ PARAMETERS
Phase Space:
• Source (default: close)
• Derivative Smoothing (default: 5)
• Normalization Window (default: 50)
Shannon Entropy:
• Entropy Window (default: 20) — must be ≥ bins²
• Distribution Bins (default: 4) — matrix = bins² cells
• Noise Threshold (default: 0.85)
• Trend Threshold (default: 0.50)
Hurst Exponent:
• Hurst Window (default: 80) — 4 sub-scales internally
Phase Thresholds:
• Escape (default: 2.0σ)
• Orbit (default: 0.5σ)
• Min Confidence for Markers (default: 0.3)
Trail:
• Show Trail (default: on)
• Trail Length (default: 25 bars)
Visualization:
• Detail Mode (default: off) — shows vel/acc lines
• Color Candles (default: on)
█ RECOMMENDED USAGE
• Liquid instruments: Forex majors, indices, Gold, large-cap crypto
• Timeframes: M15–H4 intraday, D1 swing
• Not a standalone system — it qualifies your signals
█ PERFORMANCE NOTES
Optimizations applied:
• var array reuse (zero allocation per bar)
• Merged R/S passes (2 instead of 3)
• Pre-computed constants (LOG2, PI, DEG_CONV)
• Unrolled Hurst scales (no array overhead)
• Trail only on last bar
Reduce Hurst Window from 80 to 60 if performance warnings appear.
█ ACKNOWLEDGEMENTS
• Phase Space: classical mechanics and dynamical systems theory
• Shannon Entropy: Claude E. Shannon (1948)
• Conditional Entropy: information-theoretic Markov chain analysis
• Hurst Exponent: Benoit Mandelbrot & James Wallis (1969)
• UX Design: Edward Tufte, "The Visual Display of Quantitative Information" (1983)
• The integration of conditional entropy with phase space — making an indicator modulate its own display based on statistical confidence — is original to this publication
█ WHAT THIS INDICATOR IS NOT
• NOT a buy/sell signal generator
• NOT a predictor of future direction
• NOT a replacement for your system — it qualifies it
• NOT for non-standard charts (Heikin Ashi, Renko)
• All readings are inherently lagging
• Conviction Score is a confluence filter, not a backtested edge
█ DISCLAIMER
This indicator is provided for educational and informational purposes only. It does not constitute financial, investment, or trading advice. Past performance is not indicative of future results. Trading involves substantial risk of loss and is not suitable for every investor. Always conduct your own research and consult a qualified financial professional before making any trading decisions. The author is not responsible for any losses incurred from the use of this tool.
Catatan Rilis
This revision focuses on statistical robustness, state consistency, and initialization correctness rather than altering the core analytical framework.The main change is the introduction of explicit warm-up gating across the phase-space, entropy, and Hurst modules. Earlier bars can mechanically produce values before all lookback-dependent estimators are fully populated, so the oscillator now suppresses directional outputs, markers, and dashboard interpretation until all underlying windows are statistically ready.
The entropy-confidence and memory-strength components were also bounded to valid ranges in order to avoid edge-case distortions caused by finite-sample effects. This does not change the conceptual model, but it improves numerical stability and keeps the composite conviction layer internally coherent under noisy conditions.
A second structural refinement is the alignment of trajectory-trail quadrant assignment with the main phase-engine logic. This removes classification inconsistencies around axis-crossing edge cases and ensures that the trail is now a faithful visual extension of the same phase-state model used by the oscillator core.
Escape markers were revised as well: they are now emitted only when all model layers are fully ready, and they are plotted at absolute oscillator coordinates rather than generic panel locations. This makes the event geometry cleaner and more consistent with the underlying phase-magnitude construction.
Finally, the dashboard was updated to distinguish between active analytical state and warm-up state, so the script now communicates whether the model is interpreting market structure or still waiting for sufficient data.
No predictive claims or methodological shortcuts were added in this release. The purpose of this update is to improve implementation fidelity, numerical hygiene, and the interpretability of a mathematically structured oscillator built from phase-space dynamics, conditional Shannon entropy, and multi-scale Hurst analysis.
The goal of the revision is not to increase signal frequency, but to improve structural validity. The indicator should now behave more conservatively during initialization and more consistently during live interpretation, which is preferable for a model intended to describe regime structure rather than produce decorative output.
Catatan Rilis
v1.0 — Initial release• Multi-scale Hurst via 4-level R/S regression (Mandelbrot 1969)
• Conditional Shannon Entropy with Markov transition matrix
• Phase space embedding: velocity × acceleration z-score
• Smooth sigmoid angular velocity factor — replaces discontinuous
step function for stable conviction readings
• Composite conviction score with 5th-root normalization
• Phase trail: color-coded trajectory history
• Warm-up progress indicator during initialization
• Three alertconditions: Escape ▲, Escape ▼, Return to Orbit
Skrip open-source
Dengan semangat TradingView yang sesungguhnya, pembuat skrip ini telah menjadikannya sebagai sumber terbuka, sehingga para trader dapat meninjau dan memverifikasi fungsinya. Salut untuk penulisnya! Meskipun Anda dapat menggunakannya secara gratis, perlu diingat bahwa penerbitan ulang kode ini tunduk pada Tata Tertib kami.

Pernyataan Penyangkalan
Informasi dan publikasi ini tidak dimaksudkan, dan bukan merupakan, saran atau rekomendasi keuangan, investasi, trading, atau jenis lainnya yang diberikan atau didukung oleh TradingView. Baca selengkapnya di Ketentuan Penggunaan.
Skrip open-source
Dengan semangat TradingView yang sesungguhnya, pembuat skrip ini telah menjadikannya sebagai sumber terbuka, sehingga para trader dapat meninjau dan memverifikasi fungsinya. Salut untuk penulisnya! Meskipun Anda dapat menggunakannya secara gratis, perlu diingat bahwa penerbitan ulang kode ini tunduk pada Tata Tertib kami.
Pernyataan Penyangkalan
Informasi dan publikasi ini tidak dimaksudkan, dan bukan merupakan, saran atau rekomendasi keuangan, investasi, trading, atau jenis lainnya yang diberikan atau didukung oleh TradingView. Baca selengkapnya di Ketentuan Penggunaan.