OPEN-SOURCE SCRIPT
Descriptive Statistics [Variance]
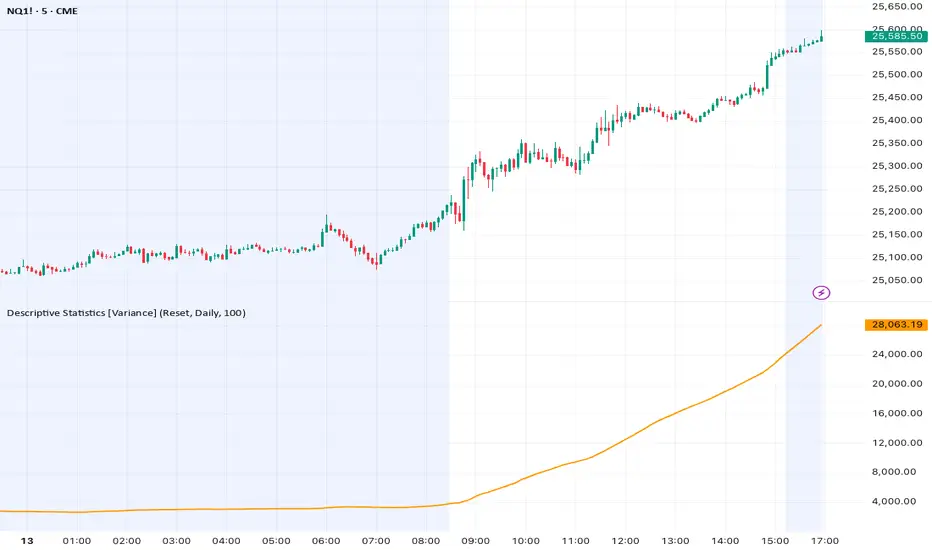
This indicator displays the Mean and Variance of price over a selected dataset. It is designed to describe the central value of price and the degree of dispersion around it.
The Mean represents the average price level over the selected period. It acts as the central reference point of the dataset.
Variance measures how spread out price values are around the Mean. It reflects the degree of variability or instability in price movement over time.
What it shows?
1. Mean: The average price level of the selected data.
2. Variance: The average squared deviation of price from the Mean.
Key concept
1. The Mean describes the center of price behavior.
2. The Variance describes how widely price moves around that center.
Together, they provide a basic statistical view of market structure and volatility.
⚠️ Note
This indicator is for analytical and educational purposes only and does not provide trading signals or directional predictions.
AUTHOR: TUGUME WILLIAM MUTARA
The Mean represents the average price level over the selected period. It acts as the central reference point of the dataset.
Variance measures how spread out price values are around the Mean. It reflects the degree of variability or instability in price movement over time.
What it shows?
1. Mean: The average price level of the selected data.
2. Variance: The average squared deviation of price from the Mean.
Key concept
1. The Mean describes the center of price behavior.
2. The Variance describes how widely price moves around that center.
Together, they provide a basic statistical view of market structure and volatility.
⚠️ Note
This indicator is for analytical and educational purposes only and does not provide trading signals or directional predictions.
AUTHOR: TUGUME WILLIAM MUTARA
Skrip open-source
Dengan semangat TradingView yang sesungguhnya, pembuat skrip ini telah menjadikannya sebagai sumber terbuka, sehingga para trader dapat meninjau dan memverifikasi fungsinya. Salut untuk penulisnya! Meskipun Anda dapat menggunakannya secara gratis, perlu diingat bahwa penerbitan ulang kode ini tunduk pada Tata Tertib kami.

Pernyataan Penyangkalan
Informasi dan publikasi ini tidak dimaksudkan, dan bukan merupakan, saran atau rekomendasi keuangan, investasi, trading, atau jenis lainnya yang diberikan atau didukung oleh TradingView. Baca selengkapnya di Ketentuan Penggunaan.
Skrip open-source
Dengan semangat TradingView yang sesungguhnya, pembuat skrip ini telah menjadikannya sebagai sumber terbuka, sehingga para trader dapat meninjau dan memverifikasi fungsinya. Salut untuk penulisnya! Meskipun Anda dapat menggunakannya secara gratis, perlu diingat bahwa penerbitan ulang kode ini tunduk pada Tata Tertib kami.
Pernyataan Penyangkalan
Informasi dan publikasi ini tidak dimaksudkan, dan bukan merupakan, saran atau rekomendasi keuangan, investasi, trading, atau jenis lainnya yang diberikan atau didukung oleh TradingView. Baca selengkapnya di Ketentuan Penggunaan.