Premium / Discount Zones
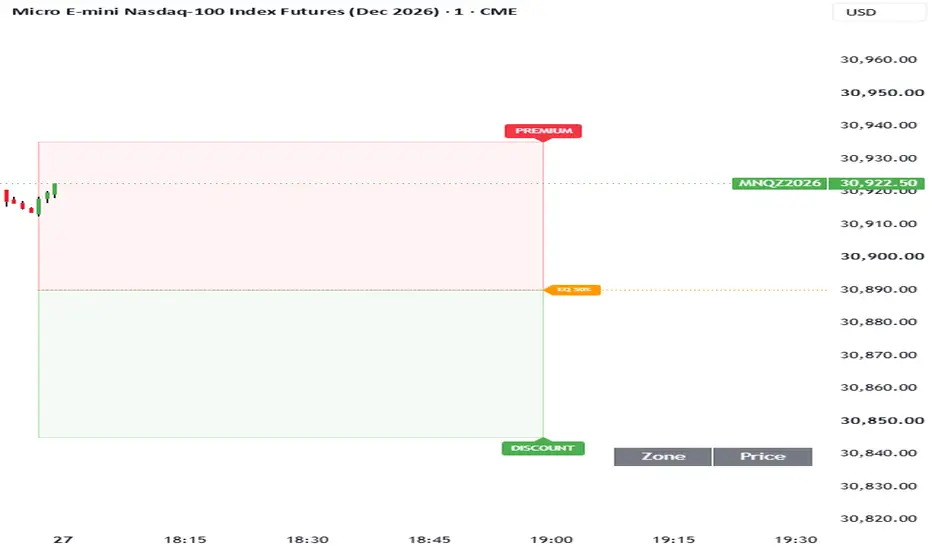
A standalone ~30-line indicator that splits the current dealing range into premium (upper half) and discount (lower half), with the 50% equilibrium as the divider. It's the smart-money framing layer — buy in discount, sell in premium.
How it calculates: It takes the highest high and lowest low over the lookback window, then splits that range at the midpoint:
Premium = midpoint → range high (red tint)
Discount = range low → midpoint (green tint)
Equilibrium (EQ 50%) = the midpoint itself (orange dotted line, extends right)
What it draws:
Premium box (red tint) — upper half
Discount box (green tint) — lower half
EQ 50% line (orange dotted, extends right)
PREMIUM / DISCOUNT / EQ 50% labels at the right edge
Range table bottom-right with the three live prices
Inputs (all under Range):
Input Default Notes
Range Lookback (bars) 100 On your 1-min MNQ chart ≈ last 100 minutes
Right Extension (bars) 60 How far boxes project forward
Fill Opacity 94 Lower = more opaque
Show Range / Labels / EQ Line / Table all on Individual toggles
Two things to know about the defaults:
1. 100 bars on a 1-minute chart is a short range. The original HTF & CISD PRO measured 100 HTF bars (≈2.5 weeks on 4H). This one measures 100 chart bars, so on your 1-min MNQ chart the dealing range is roughly the last 100 minutes — an intraday range, not a swing range. Bump the lookback if you want a wider window.
2. It's rolling, not session-anchored. The range recomputes every bar, so the premium/discount boundaries drift as old highs/lows fall out of the lookback window. That's standard ICT dealing-range behaviour — but it means the zones aren't fixed for the session.
Why it's standalone: No request.security, no lookahead, so nothing on it repaints. It was deliberately kept single-purpose to avoid colliding with the CISD/FVG/sweep layers you already run — the original script would have put a second HTF & CISD PRO on your chart.
How to use it: Price in discount + bullish structure = look for longs. Price in premium + bearish structure = look for shorts. Price at EQ = no edge, wait. It's a location filter, not a trigger — it tells you whether the price you're paying is cheap or expensive within the current range, and the actual entry still comes from your sweep/CISD/fib layers.
How it calculates: It takes the highest high and lowest low over the lookback window, then splits that range at the midpoint:
Premium = midpoint → range high (red tint)
Discount = range low → midpoint (green tint)
Equilibrium (EQ 50%) = the midpoint itself (orange dotted line, extends right)
What it draws:
Premium box (red tint) — upper half
Discount box (green tint) — lower half
EQ 50% line (orange dotted, extends right)
PREMIUM / DISCOUNT / EQ 50% labels at the right edge
Range table bottom-right with the three live prices
Inputs (all under Range):
Input Default Notes
Range Lookback (bars) 100 On your 1-min MNQ chart ≈ last 100 minutes
Right Extension (bars) 60 How far boxes project forward
Fill Opacity 94 Lower = more opaque
Show Range / Labels / EQ Line / Table all on Individual toggles
Two things to know about the defaults:
1. 100 bars on a 1-minute chart is a short range. The original HTF & CISD PRO measured 100 HTF bars (≈2.5 weeks on 4H). This one measures 100 chart bars, so on your 1-min MNQ chart the dealing range is roughly the last 100 minutes — an intraday range, not a swing range. Bump the lookback if you want a wider window.
2. It's rolling, not session-anchored. The range recomputes every bar, so the premium/discount boundaries drift as old highs/lows fall out of the lookback window. That's standard ICT dealing-range behaviour — but it means the zones aren't fixed for the session.
Why it's standalone: No request.security, no lookahead, so nothing on it repaints. It was deliberately kept single-purpose to avoid colliding with the CISD/FVG/sweep layers you already run — the original script would have put a second HTF & CISD PRO on your chart.
How to use it: Price in discount + bullish structure = look for longs. Price in premium + bearish structure = look for shorts. Price at EQ = no edge, wait. It's a location filter, not a trigger — it tells you whether the price you're paying is cheap or expensive within the current range, and the actual entry still comes from your sweep/CISD/fib layers.

Pernyataan Penyangkalan
Informasi dan publikasi ini tidak dimaksudkan, dan bukan merupakan, saran atau rekomendasi keuangan, investasi, trading, atau jenis lainnya yang diberikan atau didukung oleh TradingView. Baca selengkapnya di Ketentuan Penggunaan.
Pernyataan Penyangkalan
Informasi dan publikasi ini tidak dimaksudkan, dan bukan merupakan, saran atau rekomendasi keuangan, investasi, trading, atau jenis lainnya yang diberikan atau didukung oleh TradingView. Baca selengkapnya di Ketentuan Penggunaan.