OPEN-SOURCE SCRIPT
Moving Average Trend Viewer
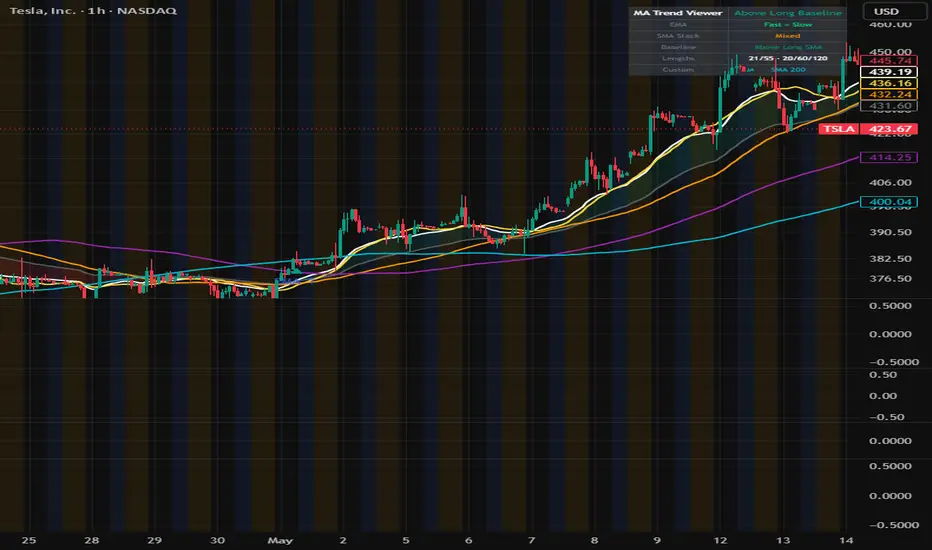
Moving Average Trend Viewer
Moving Average Trend Viewer is a chart study designed to visualize several moving averages on the same chart and help users observe trend structure, moving average alignment, crossover behavior, and price location relative to a longer-term baseline.
The script combines fast and slow EMAs, short / mid / long SMAs, and a customizable moving average into one clean viewer.
It does not provide buy or sell recommendations. The purpose of this script is to help users study moving average structure and trend context.
────────────────────
Core Concept
────────────────────
Moving averages are often used to smooth price movement and observe the direction of the broader trend.
This script focuses on three moving average concepts:
• Fast / slow EMA relationship
• Short / mid / long SMA alignment
• Price location relative to a longer-term SMA baseline
When shorter moving averages are above longer moving averages, the chart may show stronger upward structure.
When shorter moving averages are below longer moving averages, the chart may show weaker or downward structure.
When the moving averages are mixed, the market may be more neutral, transitional, or sideways.
────────────────────
What This Script Shows
────────────────────
The script can display:
• Fast EMA
• Slow EMA
• Short SMA
• Mid SMA
• Long SMA
• Custom SMA or EMA
• Optional EMA fast / slow fill zone
• Optional EMA crossover markers
• Optional SMA crossover markers
• Optional price / long SMA reference markers
• A compact trend status table
These elements are intended to make moving average structure easier to review on the chart.
────────────────────
How It Works
────────────────────
1. The script calculates a fast EMA and a slow EMA.
2. It calculates short, mid, and long simple moving averages.
3. It calculates a user-defined custom moving average using either SMA or EMA.
4. It checks whether the fast EMA is above or below the slow EMA.
5. It checks whether the short, mid, and long SMAs are aligned in bullish or bearish order.
6. It checks whether price is above or below the long SMA baseline.
7. It optionally marks crossover and baseline events.
8. It displays a status table summarizing the current moving average structure.
────────────────────
Visual Elements
────────────────────
The script includes:
• EMA Fast / Slow lines
• SMA Short / Mid / Long lines
• Custom MA line
• EMA Fast / Slow fill zone
• Reference markers for crossover events
• Reference markers for long baseline reclaim or loss
• Trend status table
The fill zone between the fast and slow EMAs helps users quickly identify whether the faster average is above or below the slower average.
────────────────────
Inputs And Customization
────────────────────
Users can adjust:
• EMA Fast length
• EMA Slow length
• SMA Short length
• SMA Mid length
• SMA Long length
• Custom MA length
• Custom MA type
• Line visibility
• Line width
• EMA zone fill
• Crossover markers
• Long baseline markers
• Status table location
The default structure uses commonly watched moving average areas, but all lengths can be customized.
────────────────────
Reference Markers
────────────────────
The script includes optional reference markers.
EMA Fast / Slow Cross:
Shows when the fast EMA crosses above or below the slow EMA.
SMA Short / Mid Cross:
Shows when the short SMA crosses above or below the mid SMA.
Price / Long SMA Events:
Shows when price crosses above or below the longer-term SMA baseline.
These markers are not trading signals. They are visual reference points for studying trend changes and moving average interaction.
────────────────────
How To Use
────────────────────
Use this script as a moving average structure viewer.
General interpretation examples:
• Fast EMA above Slow EMA may indicate stronger short-term trend structure.
• Fast EMA below Slow EMA may indicate weaker short-term trend structure.
• Short SMA above Mid SMA above Long SMA may indicate bullish alignment.
• Short SMA below Mid SMA below Long SMA may indicate bearish alignment.
• Price above the long SMA may show stronger baseline structure.
• Price below the long SMA may show weaker baseline structure.
This script should be used with independent analysis, risk management, and a defined trading plan.
────────────────────
Confirmation And Repainting Notes
────────────────────
Moving averages are calculated from current and historical price data.
Crossover markers are based on bar conditions and may appear when the selected crossover condition is met.
The script does not use future price data.
Because moving average values update as the current candle develops, users who want confirmed values should evaluate signals after bar close.
────────────────────
Limitations
────────────────────
This script does not predict future price movement.
It does not provide buy or sell recommendations.
Moving averages can lag because they are based on historical prices.
In sideways or low-volatility markets, moving average crosses may occur frequently and may not provide useful directional context.
The script should not be used as a standalone trading system.
────────────────────
Disclaimer
────────────────────
This publication is for educational and informational chart analysis only.
It does not constitute financial advice, investment advice, or a recommendation to buy or sell any financial instrument.
All trading and investment decisions are the responsibility of the user.
━━━━━━━━━━━━━━━━━━━━
Moving Average Trend Viewer
Moving Average Trend Viewer는 여러 이동평균선을 한 차트 위에 표시하여 추세 구조, 이동평균 배열, 교차 흐름, 그리고 가격이 장기 기준선과 어떤 위치 관계에 있는지 확인하기 위한 차트 분석 보조지표입니다.
이 스크립트는 빠른 EMA와 느린 EMA, 단기/중기/장기 SMA, 그리고 사용자가 직접 설정할 수 있는 커스텀 이동평균선을 하나의 뷰어로 정리합니다.
이 지표는 매수 또는 매도 추천을 제공하지 않습니다.
목적은 이동평균 구조와 추세 환경을 관찰하는 것입니다.
────────────────────
핵심 개념
────────────────────
이동평균선은 가격 움직임을 부드럽게 정리하고, 전체적인 추세 방향을 확인하는 데 자주 사용됩니다.
이 스크립트는 세 가지 이동평균 개념에 초점을 둡니다.
• 빠른 EMA와 느린 EMA의 관계
• 단기 / 중기 / 장기 SMA 배열
• 가격과 장기 SMA 기준선의 위치 관계
짧은 이동평균선이 긴 이동평균선 위에 있으면 상대적으로 강한 상승 구조로 볼 수 있습니다.
짧은 이동평균선이 긴 이동평균선 아래에 있으면 상대적으로 약하거나 하락 구조로 볼 수 있습니다.
이동평균 배열이 섞여 있으면 시장이 중립, 전환, 또는 횡보 구간에 있을 수 있습니다.
────────────────────
표시 요소
────────────────────
이 스크립트는 다음 요소를 표시할 수 있습니다.
• 빠른 EMA
• 느린 EMA
• 단기 SMA
• 중기 SMA
• 장기 SMA
• 커스텀 SMA 또는 EMA
• 선택 가능한 EMA Fast / Slow 구간 채움
• 선택 가능한 EMA 교차 마커
• 선택 가능한 SMA 교차 마커
• 선택 가능한 가격 / 장기 SMA 기준선 참고 마커
• 간단한 추세 상태 테이블
이 요소들은 차트 위에서 이동평균 구조를 더 쉽게 복기하기 위한 시각적 참고 자료입니다.
────────────────────
작동 방식
────────────────────
1. 빠른 EMA와 느린 EMA를 계산합니다.
2. 단기, 중기, 장기 단순 이동평균선을 계산합니다.
3. 사용자가 선택한 SMA 또는 EMA 방식으로 커스텀 이동평균선을 계산합니다.
4. 빠른 EMA가 느린 EMA 위에 있는지 아래에 있는지 확인합니다.
5. 단기, 중기, 장기 SMA가 상승 배열인지 하락 배열인지 확인합니다.
6. 가격이 장기 SMA 기준선 위에 있는지 아래에 있는지 확인합니다.
7. 선택에 따라 교차 및 기준선 이벤트를 표시합니다.
8. 현재 이동평균 구조를 상태 테이블로 요약합니다.
────────────────────
시각 요소
────────────────────
이 스크립트는 다음 시각 요소를 포함합니다.
• EMA Fast / Slow 라인
• SMA Short / Mid / Long 라인
• Custom MA 라인
• EMA Fast / Slow 구간 채움
• 교차 이벤트 참고 마커
• 장기 기준선 회복 또는 이탈 참고 마커
• 추세 상태 테이블
빠른 EMA와 느린 EMA 사이의 채움 영역은 빠른 평균선이 느린 평균선 위에 있는지 아래에 있는지를 빠르게 확인하는 데 도움을 줍니다.
────────────────────
입력값 및 설정
────────────────────
사용자는 다음 항목을 조정할 수 있습니다.
• EMA Fast 기간
• EMA Slow 기간
• SMA Short 기간
• SMA Mid 기간
• SMA Long 기간
• Custom MA 기간
• Custom MA 유형
• 라인 표시 여부
• 라인 두께
• EMA 구간 채움
• 교차 마커
• 장기 기준선 마커
• 상태 테이블 위치
기본 구조는 자주 참고되는 이동평균 영역을 사용하지만, 모든 기간은 사용자가 직접 조정할 수 있습니다.
────────────────────
참고 마커
────────────────────
이 스크립트에는 선택 가능한 참고 마커가 포함되어 있습니다.
EMA Fast / Slow Cross:
빠른 EMA가 느린 EMA를 상향 또는 하향 교차할 때 표시합니다.
SMA Short / Mid Cross:
단기 SMA가 중기 SMA를 상향 또는 하향 교차할 때 표시합니다.
Price / Long SMA Events:
가격이 장기 SMA 기준선을 상향 돌파하거나 하향 이탈할 때 표시합니다.
이 마커들은 매매 신호가 아닙니다.
추세 변화와 이동평균선 간의 상호작용을 관찰하기 위한 시각적 참고 지점입니다.
────────────────────
사용 방법
────────────────────
이 스크립트는 이동평균 구조 확인용 보조지표로 사용할 수 있습니다.
일반적인 해석 예시는 다음과 같습니다.
• 빠른 EMA가 느린 EMA 위에 있으면 단기 추세 구조가 상대적으로 강할 수 있습니다.
• 빠른 EMA가 느린 EMA 아래에 있으면 단기 추세 구조가 상대적으로 약할 수 있습니다.
• 단기 SMA가 중기 SMA 위에 있고, 중기 SMA가 장기 SMA 위에 있으면 상승 배열로 볼 수 있습니다.
• 단기 SMA가 중기 SMA 아래에 있고, 중기 SMA가 장기 SMA 아래에 있으면 하락 배열로 볼 수 있습니다.
• 가격이 장기 SMA 위에 있으면 기준선 위의 구조로 볼 수 있습니다.
• 가격이 장기 SMA 아래에 있으면 기준선 아래의 구조로 볼 수 있습니다.
이 스크립트는 독립적인 분석, 리스크 관리, 본인의 매매 계획과 함께 참고해야 합니다.
────────────────────
확인봉 및 리페인트 안내
────────────────────
이동평균선은 현재 및 과거 가격 데이터를 기반으로 계산됩니다.
교차 마커는 선택된 교차 조건이 충족될 때 표시됩니다.
이 스크립트는 미래 가격 데이터를 사용하지 않습니다.
현재 진행 중인 캔들의 이동평균 값은 캔들이 완성되기 전까지 변할 수 있으므로, 확정 값을 원하는 사용자는 봉 마감 이후 기준으로 확인해야 합니다.
────────────────────
한계
────────────────────
이 스크립트는 미래 가격 움직임을 예측하지 않습니다.
매수 또는 매도 추천을 제공하지 않습니다.
이동평균선은 과거 가격을 기반으로 하므로 지연성이 있습니다.
횡보장 또는 저변동성 구간에서는 이동평균 교차가 자주 발생할 수 있으며, 방향성 판단에 유용하지 않을 수 있습니다.
이 스크립트를 단독 매매 시스템으로 사용해서는 안 됩니다.
────────────────────
중요 고지
────────────────────
본 게시물은 교육 및 정보 제공 목적의 차트 분석 자료입니다.
투자 자문, 매수·매도 추천, 특정 금융상품 거래 권유를 의미하지 않습니다.
모든 투자 판단과 그 결과에 대한 책임은 이용자 본인에게 있습니다.
Moving Average Trend Viewer is a chart study designed to visualize several moving averages on the same chart and help users observe trend structure, moving average alignment, crossover behavior, and price location relative to a longer-term baseline.
The script combines fast and slow EMAs, short / mid / long SMAs, and a customizable moving average into one clean viewer.
It does not provide buy or sell recommendations. The purpose of this script is to help users study moving average structure and trend context.
────────────────────
Core Concept
────────────────────
Moving averages are often used to smooth price movement and observe the direction of the broader trend.
This script focuses on three moving average concepts:
• Fast / slow EMA relationship
• Short / mid / long SMA alignment
• Price location relative to a longer-term SMA baseline
When shorter moving averages are above longer moving averages, the chart may show stronger upward structure.
When shorter moving averages are below longer moving averages, the chart may show weaker or downward structure.
When the moving averages are mixed, the market may be more neutral, transitional, or sideways.
────────────────────
What This Script Shows
────────────────────
The script can display:
• Fast EMA
• Slow EMA
• Short SMA
• Mid SMA
• Long SMA
• Custom SMA or EMA
• Optional EMA fast / slow fill zone
• Optional EMA crossover markers
• Optional SMA crossover markers
• Optional price / long SMA reference markers
• A compact trend status table
These elements are intended to make moving average structure easier to review on the chart.
────────────────────
How It Works
────────────────────
1. The script calculates a fast EMA and a slow EMA.
2. It calculates short, mid, and long simple moving averages.
3. It calculates a user-defined custom moving average using either SMA or EMA.
4. It checks whether the fast EMA is above or below the slow EMA.
5. It checks whether the short, mid, and long SMAs are aligned in bullish or bearish order.
6. It checks whether price is above or below the long SMA baseline.
7. It optionally marks crossover and baseline events.
8. It displays a status table summarizing the current moving average structure.
────────────────────
Visual Elements
────────────────────
The script includes:
• EMA Fast / Slow lines
• SMA Short / Mid / Long lines
• Custom MA line
• EMA Fast / Slow fill zone
• Reference markers for crossover events
• Reference markers for long baseline reclaim or loss
• Trend status table
The fill zone between the fast and slow EMAs helps users quickly identify whether the faster average is above or below the slower average.
────────────────────
Inputs And Customization
────────────────────
Users can adjust:
• EMA Fast length
• EMA Slow length
• SMA Short length
• SMA Mid length
• SMA Long length
• Custom MA length
• Custom MA type
• Line visibility
• Line width
• EMA zone fill
• Crossover markers
• Long baseline markers
• Status table location
The default structure uses commonly watched moving average areas, but all lengths can be customized.
────────────────────
Reference Markers
────────────────────
The script includes optional reference markers.
EMA Fast / Slow Cross:
Shows when the fast EMA crosses above or below the slow EMA.
SMA Short / Mid Cross:
Shows when the short SMA crosses above or below the mid SMA.
Price / Long SMA Events:
Shows when price crosses above or below the longer-term SMA baseline.
These markers are not trading signals. They are visual reference points for studying trend changes and moving average interaction.
────────────────────
How To Use
────────────────────
Use this script as a moving average structure viewer.
General interpretation examples:
• Fast EMA above Slow EMA may indicate stronger short-term trend structure.
• Fast EMA below Slow EMA may indicate weaker short-term trend structure.
• Short SMA above Mid SMA above Long SMA may indicate bullish alignment.
• Short SMA below Mid SMA below Long SMA may indicate bearish alignment.
• Price above the long SMA may show stronger baseline structure.
• Price below the long SMA may show weaker baseline structure.
This script should be used with independent analysis, risk management, and a defined trading plan.
────────────────────
Confirmation And Repainting Notes
────────────────────
Moving averages are calculated from current and historical price data.
Crossover markers are based on bar conditions and may appear when the selected crossover condition is met.
The script does not use future price data.
Because moving average values update as the current candle develops, users who want confirmed values should evaluate signals after bar close.
────────────────────
Limitations
────────────────────
This script does not predict future price movement.
It does not provide buy or sell recommendations.
Moving averages can lag because they are based on historical prices.
In sideways or low-volatility markets, moving average crosses may occur frequently and may not provide useful directional context.
The script should not be used as a standalone trading system.
────────────────────
Disclaimer
────────────────────
This publication is for educational and informational chart analysis only.
It does not constitute financial advice, investment advice, or a recommendation to buy or sell any financial instrument.
All trading and investment decisions are the responsibility of the user.
━━━━━━━━━━━━━━━━━━━━
Moving Average Trend Viewer
Moving Average Trend Viewer는 여러 이동평균선을 한 차트 위에 표시하여 추세 구조, 이동평균 배열, 교차 흐름, 그리고 가격이 장기 기준선과 어떤 위치 관계에 있는지 확인하기 위한 차트 분석 보조지표입니다.
이 스크립트는 빠른 EMA와 느린 EMA, 단기/중기/장기 SMA, 그리고 사용자가 직접 설정할 수 있는 커스텀 이동평균선을 하나의 뷰어로 정리합니다.
이 지표는 매수 또는 매도 추천을 제공하지 않습니다.
목적은 이동평균 구조와 추세 환경을 관찰하는 것입니다.
────────────────────
핵심 개념
────────────────────
이동평균선은 가격 움직임을 부드럽게 정리하고, 전체적인 추세 방향을 확인하는 데 자주 사용됩니다.
이 스크립트는 세 가지 이동평균 개념에 초점을 둡니다.
• 빠른 EMA와 느린 EMA의 관계
• 단기 / 중기 / 장기 SMA 배열
• 가격과 장기 SMA 기준선의 위치 관계
짧은 이동평균선이 긴 이동평균선 위에 있으면 상대적으로 강한 상승 구조로 볼 수 있습니다.
짧은 이동평균선이 긴 이동평균선 아래에 있으면 상대적으로 약하거나 하락 구조로 볼 수 있습니다.
이동평균 배열이 섞여 있으면 시장이 중립, 전환, 또는 횡보 구간에 있을 수 있습니다.
────────────────────
표시 요소
────────────────────
이 스크립트는 다음 요소를 표시할 수 있습니다.
• 빠른 EMA
• 느린 EMA
• 단기 SMA
• 중기 SMA
• 장기 SMA
• 커스텀 SMA 또는 EMA
• 선택 가능한 EMA Fast / Slow 구간 채움
• 선택 가능한 EMA 교차 마커
• 선택 가능한 SMA 교차 마커
• 선택 가능한 가격 / 장기 SMA 기준선 참고 마커
• 간단한 추세 상태 테이블
이 요소들은 차트 위에서 이동평균 구조를 더 쉽게 복기하기 위한 시각적 참고 자료입니다.
────────────────────
작동 방식
────────────────────
1. 빠른 EMA와 느린 EMA를 계산합니다.
2. 단기, 중기, 장기 단순 이동평균선을 계산합니다.
3. 사용자가 선택한 SMA 또는 EMA 방식으로 커스텀 이동평균선을 계산합니다.
4. 빠른 EMA가 느린 EMA 위에 있는지 아래에 있는지 확인합니다.
5. 단기, 중기, 장기 SMA가 상승 배열인지 하락 배열인지 확인합니다.
6. 가격이 장기 SMA 기준선 위에 있는지 아래에 있는지 확인합니다.
7. 선택에 따라 교차 및 기준선 이벤트를 표시합니다.
8. 현재 이동평균 구조를 상태 테이블로 요약합니다.
────────────────────
시각 요소
────────────────────
이 스크립트는 다음 시각 요소를 포함합니다.
• EMA Fast / Slow 라인
• SMA Short / Mid / Long 라인
• Custom MA 라인
• EMA Fast / Slow 구간 채움
• 교차 이벤트 참고 마커
• 장기 기준선 회복 또는 이탈 참고 마커
• 추세 상태 테이블
빠른 EMA와 느린 EMA 사이의 채움 영역은 빠른 평균선이 느린 평균선 위에 있는지 아래에 있는지를 빠르게 확인하는 데 도움을 줍니다.
────────────────────
입력값 및 설정
────────────────────
사용자는 다음 항목을 조정할 수 있습니다.
• EMA Fast 기간
• EMA Slow 기간
• SMA Short 기간
• SMA Mid 기간
• SMA Long 기간
• Custom MA 기간
• Custom MA 유형
• 라인 표시 여부
• 라인 두께
• EMA 구간 채움
• 교차 마커
• 장기 기준선 마커
• 상태 테이블 위치
기본 구조는 자주 참고되는 이동평균 영역을 사용하지만, 모든 기간은 사용자가 직접 조정할 수 있습니다.
────────────────────
참고 마커
────────────────────
이 스크립트에는 선택 가능한 참고 마커가 포함되어 있습니다.
EMA Fast / Slow Cross:
빠른 EMA가 느린 EMA를 상향 또는 하향 교차할 때 표시합니다.
SMA Short / Mid Cross:
단기 SMA가 중기 SMA를 상향 또는 하향 교차할 때 표시합니다.
Price / Long SMA Events:
가격이 장기 SMA 기준선을 상향 돌파하거나 하향 이탈할 때 표시합니다.
이 마커들은 매매 신호가 아닙니다.
추세 변화와 이동평균선 간의 상호작용을 관찰하기 위한 시각적 참고 지점입니다.
────────────────────
사용 방법
────────────────────
이 스크립트는 이동평균 구조 확인용 보조지표로 사용할 수 있습니다.
일반적인 해석 예시는 다음과 같습니다.
• 빠른 EMA가 느린 EMA 위에 있으면 단기 추세 구조가 상대적으로 강할 수 있습니다.
• 빠른 EMA가 느린 EMA 아래에 있으면 단기 추세 구조가 상대적으로 약할 수 있습니다.
• 단기 SMA가 중기 SMA 위에 있고, 중기 SMA가 장기 SMA 위에 있으면 상승 배열로 볼 수 있습니다.
• 단기 SMA가 중기 SMA 아래에 있고, 중기 SMA가 장기 SMA 아래에 있으면 하락 배열로 볼 수 있습니다.
• 가격이 장기 SMA 위에 있으면 기준선 위의 구조로 볼 수 있습니다.
• 가격이 장기 SMA 아래에 있으면 기준선 아래의 구조로 볼 수 있습니다.
이 스크립트는 독립적인 분석, 리스크 관리, 본인의 매매 계획과 함께 참고해야 합니다.
────────────────────
확인봉 및 리페인트 안내
────────────────────
이동평균선은 현재 및 과거 가격 데이터를 기반으로 계산됩니다.
교차 마커는 선택된 교차 조건이 충족될 때 표시됩니다.
이 스크립트는 미래 가격 데이터를 사용하지 않습니다.
현재 진행 중인 캔들의 이동평균 값은 캔들이 완성되기 전까지 변할 수 있으므로, 확정 값을 원하는 사용자는 봉 마감 이후 기준으로 확인해야 합니다.
────────────────────
한계
────────────────────
이 스크립트는 미래 가격 움직임을 예측하지 않습니다.
매수 또는 매도 추천을 제공하지 않습니다.
이동평균선은 과거 가격을 기반으로 하므로 지연성이 있습니다.
횡보장 또는 저변동성 구간에서는 이동평균 교차가 자주 발생할 수 있으며, 방향성 판단에 유용하지 않을 수 있습니다.
이 스크립트를 단독 매매 시스템으로 사용해서는 안 됩니다.
────────────────────
중요 고지
────────────────────
본 게시물은 교육 및 정보 제공 목적의 차트 분석 자료입니다.
투자 자문, 매수·매도 추천, 특정 금융상품 거래 권유를 의미하지 않습니다.
모든 투자 판단과 그 결과에 대한 책임은 이용자 본인에게 있습니다.
Skrip open-source
Dengan semangat TradingView yang sesungguhnya, pembuat skrip ini telah menjadikannya sebagai sumber terbuka, sehingga para trader dapat meninjau dan memverifikasi fungsinya. Salut untuk penulisnya! Meskipun Anda dapat menggunakannya secara gratis, perlu diingat bahwa penerbitan ulang kode ini tunduk pada Tata Tertib kami.

Pernyataan Penyangkalan
Informasi dan publikasi ini tidak dimaksudkan, dan bukan merupakan, saran atau rekomendasi keuangan, investasi, trading, atau jenis lainnya yang diberikan atau didukung oleh TradingView. Baca selengkapnya di Ketentuan Penggunaan.
Skrip open-source
Dengan semangat TradingView yang sesungguhnya, pembuat skrip ini telah menjadikannya sebagai sumber terbuka, sehingga para trader dapat meninjau dan memverifikasi fungsinya. Salut untuk penulisnya! Meskipun Anda dapat menggunakannya secara gratis, perlu diingat bahwa penerbitan ulang kode ini tunduk pada Tata Tertib kami.
Pernyataan Penyangkalan
Informasi dan publikasi ini tidak dimaksudkan, dan bukan merupakan, saran atau rekomendasi keuangan, investasi, trading, atau jenis lainnya yang diberikan atau didukung oleh TradingView. Baca selengkapnya di Ketentuan Penggunaan.