ANAX | Shark & Kill Zones MTF v4
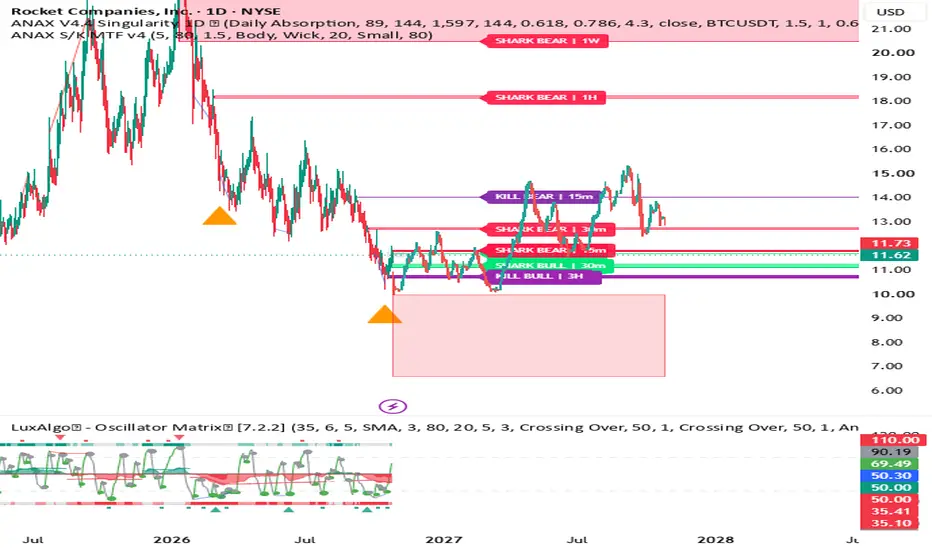
ANAX | Shark & Kill Zones MTF
Multi-Timeframe Liquidity Intelligence | High-Volume Order Blocks & Confluence Zones
Overview
ANAX Shark & Kill Zones MTF is a multi-timeframe market structure and liquidity analysis indicator designed to identify and visualize selected high-volume Order Blocks and areas of confluence between Order Blocks and Fair Value Gaps.
Instead of filling the chart with dozens of conventional Order Blocks and imbalances, ANAX focuses on two specific types of price zones:
Shark Zones: Order Blocks associated with elevated trading volume.
Kill Zones: Price areas where a directional Order Block overlaps with a Fair Value Gap.
The objective is to provide a cleaner view of selected potential support, resistance, and reaction areas across multiple timeframes.
13 Timeframes. One Chart.
ANAX independently evaluates 13 timeframes:
1m | 3m | 5m | 15m | 30m | 1H | 2H | 3H | 4H | 1D | 3D | 1W | 1M
Zones from enabled timeframes can be displayed together on the active chart.
For example, when analyzing a Daily chart, traders can also view detected zones from intraday, multi-day, weekly, and monthly timeframes without manually switching between charts.
Each displayed zone includes a label identifying its type, direction, and originating timeframe.
Shark Zones: High-Volume Order Blocks
Shark Zones represent Order Blocks that meet a relative-volume threshold.
The detection process combines confirmed swing pivots, directional price breaks, the identification of a preceding opposite-direction candle, and volume comparison against a moving average.
By default, an Order Block qualifies as a Shark when its candle volume exceeds 1.5 times its 50-period average volume.
Green: Bullish Shark Zone
An identified bullish Order Block with elevated relative volume.
Red: Bearish Shark Zone
An identified bearish Order Block with elevated relative volume.
High volume does not prove institutional participation. Shark is simply the indicator's designation for an Order Block meeting its volume criteria.
Kill Zones: OB + FVG Confluence
Kill Zones identify price intervals where two independently detected structures overlap:
An Order Block.
A Fair Value Gap in the same direction.
Only their shared price interval is displayed as the Kill Zone.
Purple: Bullish or Bearish Kill Zone
The label identifies the direction and originating timeframe.
These zones represent structural confluence rather than guaranteed reversal or continuation points.
A Kill Zone does not require the underlying Order Block to qualify as a high-volume Shark.
Heikin-Ashi-Based Detection
ANAX uses Heikin-Ashi candle data for its detection calculations, independently within each requested timeframe.
This approach provides an alternative representation of directional price structure.
Because Heikin-Ashi prices are synthetic, detected zones may differ from levels calculated using conventional OHLC candles.
These zones should be treated as analytical references, not necessarily as executable market prices.
Chart Clarity
The indicator deliberately hides ordinary Order Blocks and Fair Value Gaps while retaining them internally for zone detection.
Its chart display focuses on Shark Zones and Kill Zones.
Additional display controls allow traders to:
Enable or disable individual timeframes.
Show bullish, bearish, Shark, or Kill Zones separately.
Customize zone colors.
Adjust timeframe-label sizes.
Move labels horizontally away from price candles.
How to Use
Step 1: Identify higher-timeframe zones
Start with the Daily, Weekly, or Monthly zones to understand where selected structural price areas are located.
Step 2: Compare lower-timeframe structures
Observe intraday Shark and Kill Zones near those higher-timeframe levels.
Step 3: Watch price response
Evaluate how price behaves as it approaches or interacts with a detected zone. Consider market structure, volume, volatility, and confirmation from other independent methods.
Step 4: Apply independent risk management
Use your own entry criteria, invalidation levels, and position-sizing rules rather than assuming that a detected zone will produce a reversal.
Important Limitations
The indicator displays the most recently detected surviving Shark and Kill Zone of each direction within each enabled timeframe. It does not display every historical zone.
A zone can disappear when the underlying structure is invalidated or mitigated according to the selected rules.
Pivot identification requires subsequent candles for confirmation.
Developing timeframe values can change before the relevant candle closes. Higher-timeframe and lower-timeframe data mapping can also affect historical and live displays.
Lower-timeframe information requested from a higher-timeframe chart is subject to TradingView's data aggregation limitations.
Volume availability and quality depend on the instrument and data provider.
Zone detection does not establish order-book liquidity, institutional ownership, or future price direction.
This is an analytical indicator, not an automated trading strategy. It does not provide verified profitability statistics or guaranteed trading signals.
Closing
ANAX Shark & Kill Zones MTF is built around a focused principle:
Reduce visual noise. Preserve meaningful structural information. Make multi-timeframe analysis easier to interpret.
Rather than displaying every detected Order Block and imbalance, the indicator concentrates on high-relative-volume structures and Order Block/Fair Value Gap confluence.
Designed for traders who prefer a selective, multi-timeframe approach to chart analysis.
Developed as part of the ANAX indicator series.
For educational and analytical purposes only. Not financial advice.
Multi-Timeframe Liquidity Intelligence | High-Volume Order Blocks & Confluence Zones
Overview
ANAX Shark & Kill Zones MTF is a multi-timeframe market structure and liquidity analysis indicator designed to identify and visualize selected high-volume Order Blocks and areas of confluence between Order Blocks and Fair Value Gaps.
Instead of filling the chart with dozens of conventional Order Blocks and imbalances, ANAX focuses on two specific types of price zones:
Shark Zones: Order Blocks associated with elevated trading volume.
Kill Zones: Price areas where a directional Order Block overlaps with a Fair Value Gap.
The objective is to provide a cleaner view of selected potential support, resistance, and reaction areas across multiple timeframes.
13 Timeframes. One Chart.
ANAX independently evaluates 13 timeframes:
1m | 3m | 5m | 15m | 30m | 1H | 2H | 3H | 4H | 1D | 3D | 1W | 1M
Zones from enabled timeframes can be displayed together on the active chart.
For example, when analyzing a Daily chart, traders can also view detected zones from intraday, multi-day, weekly, and monthly timeframes without manually switching between charts.
Each displayed zone includes a label identifying its type, direction, and originating timeframe.
Shark Zones: High-Volume Order Blocks
Shark Zones represent Order Blocks that meet a relative-volume threshold.
The detection process combines confirmed swing pivots, directional price breaks, the identification of a preceding opposite-direction candle, and volume comparison against a moving average.
By default, an Order Block qualifies as a Shark when its candle volume exceeds 1.5 times its 50-period average volume.
Green: Bullish Shark Zone
An identified bullish Order Block with elevated relative volume.
Red: Bearish Shark Zone
An identified bearish Order Block with elevated relative volume.
High volume does not prove institutional participation. Shark is simply the indicator's designation for an Order Block meeting its volume criteria.
Kill Zones: OB + FVG Confluence
Kill Zones identify price intervals where two independently detected structures overlap:
An Order Block.
A Fair Value Gap in the same direction.
Only their shared price interval is displayed as the Kill Zone.
Purple: Bullish or Bearish Kill Zone
The label identifies the direction and originating timeframe.
These zones represent structural confluence rather than guaranteed reversal or continuation points.
A Kill Zone does not require the underlying Order Block to qualify as a high-volume Shark.
Heikin-Ashi-Based Detection
ANAX uses Heikin-Ashi candle data for its detection calculations, independently within each requested timeframe.
This approach provides an alternative representation of directional price structure.
Because Heikin-Ashi prices are synthetic, detected zones may differ from levels calculated using conventional OHLC candles.
These zones should be treated as analytical references, not necessarily as executable market prices.
Chart Clarity
The indicator deliberately hides ordinary Order Blocks and Fair Value Gaps while retaining them internally for zone detection.
Its chart display focuses on Shark Zones and Kill Zones.
Additional display controls allow traders to:
Enable or disable individual timeframes.
Show bullish, bearish, Shark, or Kill Zones separately.
Customize zone colors.
Adjust timeframe-label sizes.
Move labels horizontally away from price candles.
How to Use
Step 1: Identify higher-timeframe zones
Start with the Daily, Weekly, or Monthly zones to understand where selected structural price areas are located.
Step 2: Compare lower-timeframe structures
Observe intraday Shark and Kill Zones near those higher-timeframe levels.
Step 3: Watch price response
Evaluate how price behaves as it approaches or interacts with a detected zone. Consider market structure, volume, volatility, and confirmation from other independent methods.
Step 4: Apply independent risk management
Use your own entry criteria, invalidation levels, and position-sizing rules rather than assuming that a detected zone will produce a reversal.
Important Limitations
The indicator displays the most recently detected surviving Shark and Kill Zone of each direction within each enabled timeframe. It does not display every historical zone.
A zone can disappear when the underlying structure is invalidated or mitigated according to the selected rules.
Pivot identification requires subsequent candles for confirmation.
Developing timeframe values can change before the relevant candle closes. Higher-timeframe and lower-timeframe data mapping can also affect historical and live displays.
Lower-timeframe information requested from a higher-timeframe chart is subject to TradingView's data aggregation limitations.
Volume availability and quality depend on the instrument and data provider.
Zone detection does not establish order-book liquidity, institutional ownership, or future price direction.
This is an analytical indicator, not an automated trading strategy. It does not provide verified profitability statistics or guaranteed trading signals.
Closing
ANAX Shark & Kill Zones MTF is built around a focused principle:
Reduce visual noise. Preserve meaningful structural information. Make multi-timeframe analysis easier to interpret.
Rather than displaying every detected Order Block and imbalance, the indicator concentrates on high-relative-volume structures and Order Block/Fair Value Gap confluence.
Designed for traders who prefer a selective, multi-timeframe approach to chart analysis.
Developed as part of the ANAX indicator series.
For educational and analytical purposes only. Not financial advice.

Pernyataan Penyangkalan
Informasi dan publikasi ini tidak dimaksudkan, dan bukan merupakan, saran atau rekomendasi keuangan, investasi, trading, atau jenis lainnya yang diberikan atau didukung oleh TradingView. Baca selengkapnya di Ketentuan Penggunaan.
Pernyataan Penyangkalan
Informasi dan publikasi ini tidak dimaksudkan, dan bukan merupakan, saran atau rekomendasi keuangan, investasi, trading, atau jenis lainnya yang diberikan atau didukung oleh TradingView. Baca selengkapnya di Ketentuan Penggunaan.