Fractal Universal Moving Averages
A moving average does not know what time it is. Its length is a count of bars, so a 50-period average means fifty days on a daily chart, fifty hours on an hourly chart and fifty quarter-hours on a 15-minute chart. The same setting describes three different crowds, and the label on the line never names the crowd in view.
Fractal Universal Moving Averages (FUMAs) is built on the premise that a moving average should be specified in time and then converted into the bars of whatever chart is open. It carries daily and weekly consensus onto intraday charts as smooth lines, draws a ranked braid of daily averages on the daily chart, and draws a weekly suite on the weekly chart. The sections below explain why ordinary averages break when the timeframe changes, why the usual repair creates new problems, and how to read the hourly chart above.
A Length Is Counted in Bars, Not in Time
Every standard moving average takes its length in bars. A trader who learns a 50-period average on the daily chart and then drops to the hourly chart without changing the setting is no longer watching a ten-week consensus. On a market that trades around the clock, fifty hourly bars cover roughly two days. On a regular-hours stock, which prints about seven hourly bars per session, they cover roughly seven sessions.
The distortion grows as the clock gets faster. A 200-period average, the market's most quoted line, spans 200 sessions on the daily chart, between eight days and nearly six weeks of trading on the hourly chart depending on the market's hours, and fewer than eight sessions of stock trading on the 15-minute chart. Each of those lines is calculated correctly. Each one answers a different question, and the chart presents all of them under the same name.
Volume-weighted averages inherit the same problem with a second layer. The volume in a bar depends on how long the bar lasts, so a VWMA weights participation differently on every clock. A trader comparing a daily VWMA with an hourly one compares two ledgers kept in different currencies.
The Usual Repair Builds a Staircase
The common remedy imports the higher timeframe's average directly. The daily average is calculated on daily bars and projected onto the hourly chart, where it holds one value for the whole session and then jumps when the next day begins. The result looks like a staircase laid across a ramp, and price spends every session negotiating with a level that cannot move until the session ends.
The staircase forces a second compromise. Either the imported line waits for the higher bar to close, so each step arrives late, or it updates with the forming bar and revises values the chart has already displayed. A trader working an hourly setup then reads either yesterday's consensus or a consensus that may change after the decision.
Translation avoids both compromises. Instead of importing a daily average, FUMAs builds an average whose memory spans one day, measured in the chart's own bars, and updates it on every bar. The line moves continuously beside price, it never revises a closed bar, and it keeps the meaning the trader intended when choosing the word "daily."
Translation Instead of Importation
On minute and hour charts, the instrument draws three lines. A daily EMA and a daily VWMA each average one day of bars, and a weekly EMA averages one week of bars. On the hourly chart those lengths are 24 and 120 bars; on the 15-minute chart they are 96 and 480. A seven-day option extends the weekly anchor to a full calendar week for markets that never close, crypto above all.
The space between the daily EMA and the daily VWMA is filled, and its color reports leadership. An EMA lead means price momentum is running ahead of the volume-weighted consensus. A VWMA lead means volume is building beneath price ahead of momentum's catch-up. The fill works like a litmus strip dipped into order flow, since the color itself is the measurement.
The weekly EMA is the ribbon's slowest line and its most important one. A pullback that touches the weekly anchor and closes back beyond it produces the strongest continuation reading the ribbon offers. A close through the anchor in the opposite direction places the intermediate structure under pressure. Between those events the anchor behaves like a waterline painted on a hull, where the crossing matters more than the ride.
The Chart Chooses the Form
The instrument reads the chart's resolution each time it loads and takes the form that suits it. The daily chart receives a braid of three filled pairs that turn at three speeds: a 21-day SMA and EMA that lead, a 50-day and 200-day EMA pair that confirms, and a 50-day and 200-day SMA pair that defines the trend. The weekly chart receives a 7-week EMA and VWMA ribbon, a 30-week ribbon, and a 200-week Hull average beneath both. On those clocks the averages are native, so no translation is needed.
Charts in seconds, ticks, months or years receive a visible refusal instead of a distortion. The instrument draws nothing and posts a single centered notice naming the supported resolutions. A stretched ribbon on a seconds chart would have produced a line with no defensible meaning, and a quiet failure of that kind would teach the wrong lesson.
Inactive forms resolve to nothing at the value level, so the Data Window and the legend show live numbers only for the active form. One script also carries all three forms, so a layout that moves between the 15-minute, hourly, daily and weekly charts spends a single indicator slot on its averages. The recovered room can hold the volume, momentum or structure tools that averages cannot replace.
Reading the Screenshot
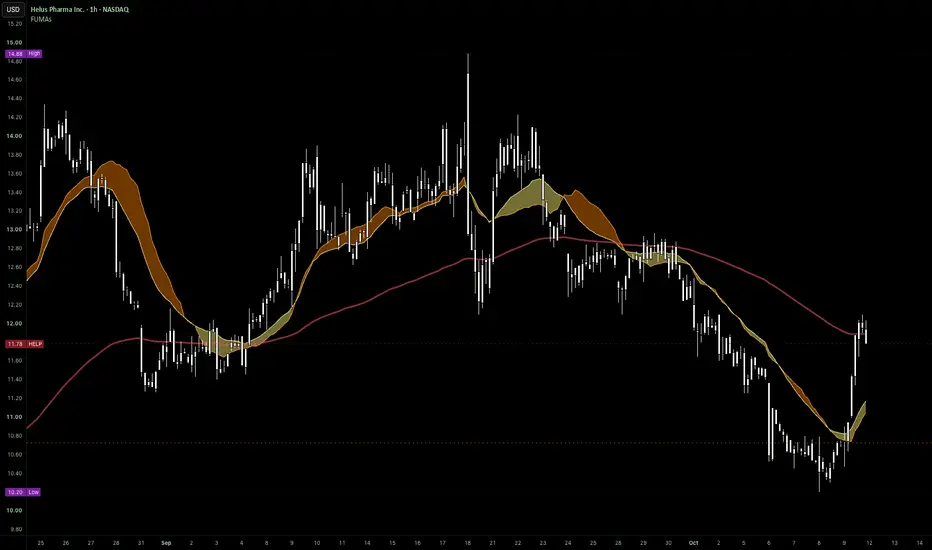
The chart above shows Helus Pharma (HELP) on the hourly clock with regular hours, captured after the close of 9 October, with the ribbon in a custom palette. The legend reads the daily EMA at 11.17, the daily VWMA at 11.04 and the weekly EMA at 11.88, followed by empty markers for the dormant daily and weekly forms. Price rallied through September with the ribbon riding above a rising weekly anchor and printed its 14.88 high on 18 September. The ribbon crossed beneath the anchor at month's end and followed price down to the 10.20 low of 8 October.
On 9 October price surged back through both daily lines, and the fill turned to show momentum leading volume. Price closed at 11.78, just beneath the weekly anchor at 11.88. A close back above the anchor would convert a sharp bounce into a reclaim, while a rejection would leave the anchor marking the boundary between a pullback and damage. The instrument does not answer that question; it shows where the answer will be printed.
FUMAs is a supplementary instrument. It reports where slower consensus lies and whether momentum or volume leads, and it leaves the trigger to the trader's own method. A trend trail, a volume profile and bar-by-bar volume analysis supply push, location and participation, which the averages cannot measure. Nothing in this description or in the script is financial advice, and past behavior of the averages does not predict future prices.
The Day Is a Convention
The ribbon defines a day as 1,440 minutes, which is literally true for crypto and quietly false for a regular-hours stock. On HELP's hourly chart, the 24-bar daily lines span between three and four sessions, and the 120-bar weekly anchor spans more than three weeks of trading. That stretch happens to suit equities, where pullback trading wants a slower consensus than one session can supply.
The deeper point concerns every average on every chart. A moving average is a claim on how long a market remembers, and a length typed in bars makes that claim without stating its unit. FUMAs states the unit and converts it, and in doing so it exposes the question every other average quietly answers for the trader, which is whose day, and whose week, the line is counting.
Fractal Universal Moving Averages (FUMAs) is built on the premise that a moving average should be specified in time and then converted into the bars of whatever chart is open. It carries daily and weekly consensus onto intraday charts as smooth lines, draws a ranked braid of daily averages on the daily chart, and draws a weekly suite on the weekly chart. The sections below explain why ordinary averages break when the timeframe changes, why the usual repair creates new problems, and how to read the hourly chart above.
A Length Is Counted in Bars, Not in Time
Every standard moving average takes its length in bars. A trader who learns a 50-period average on the daily chart and then drops to the hourly chart without changing the setting is no longer watching a ten-week consensus. On a market that trades around the clock, fifty hourly bars cover roughly two days. On a regular-hours stock, which prints about seven hourly bars per session, they cover roughly seven sessions.
The distortion grows as the clock gets faster. A 200-period average, the market's most quoted line, spans 200 sessions on the daily chart, between eight days and nearly six weeks of trading on the hourly chart depending on the market's hours, and fewer than eight sessions of stock trading on the 15-minute chart. Each of those lines is calculated correctly. Each one answers a different question, and the chart presents all of them under the same name.
Volume-weighted averages inherit the same problem with a second layer. The volume in a bar depends on how long the bar lasts, so a VWMA weights participation differently on every clock. A trader comparing a daily VWMA with an hourly one compares two ledgers kept in different currencies.
The Usual Repair Builds a Staircase
The common remedy imports the higher timeframe's average directly. The daily average is calculated on daily bars and projected onto the hourly chart, where it holds one value for the whole session and then jumps when the next day begins. The result looks like a staircase laid across a ramp, and price spends every session negotiating with a level that cannot move until the session ends.
The staircase forces a second compromise. Either the imported line waits for the higher bar to close, so each step arrives late, or it updates with the forming bar and revises values the chart has already displayed. A trader working an hourly setup then reads either yesterday's consensus or a consensus that may change after the decision.
Translation avoids both compromises. Instead of importing a daily average, FUMAs builds an average whose memory spans one day, measured in the chart's own bars, and updates it on every bar. The line moves continuously beside price, it never revises a closed bar, and it keeps the meaning the trader intended when choosing the word "daily."
Translation Instead of Importation
On minute and hour charts, the instrument draws three lines. A daily EMA and a daily VWMA each average one day of bars, and a weekly EMA averages one week of bars. On the hourly chart those lengths are 24 and 120 bars; on the 15-minute chart they are 96 and 480. A seven-day option extends the weekly anchor to a full calendar week for markets that never close, crypto above all.
The space between the daily EMA and the daily VWMA is filled, and its color reports leadership. An EMA lead means price momentum is running ahead of the volume-weighted consensus. A VWMA lead means volume is building beneath price ahead of momentum's catch-up. The fill works like a litmus strip dipped into order flow, since the color itself is the measurement.
The weekly EMA is the ribbon's slowest line and its most important one. A pullback that touches the weekly anchor and closes back beyond it produces the strongest continuation reading the ribbon offers. A close through the anchor in the opposite direction places the intermediate structure under pressure. Between those events the anchor behaves like a waterline painted on a hull, where the crossing matters more than the ride.
The Chart Chooses the Form
The instrument reads the chart's resolution each time it loads and takes the form that suits it. The daily chart receives a braid of three filled pairs that turn at three speeds: a 21-day SMA and EMA that lead, a 50-day and 200-day EMA pair that confirms, and a 50-day and 200-day SMA pair that defines the trend. The weekly chart receives a 7-week EMA and VWMA ribbon, a 30-week ribbon, and a 200-week Hull average beneath both. On those clocks the averages are native, so no translation is needed.
Charts in seconds, ticks, months or years receive a visible refusal instead of a distortion. The instrument draws nothing and posts a single centered notice naming the supported resolutions. A stretched ribbon on a seconds chart would have produced a line with no defensible meaning, and a quiet failure of that kind would teach the wrong lesson.
Inactive forms resolve to nothing at the value level, so the Data Window and the legend show live numbers only for the active form. One script also carries all three forms, so a layout that moves between the 15-minute, hourly, daily and weekly charts spends a single indicator slot on its averages. The recovered room can hold the volume, momentum or structure tools that averages cannot replace.
Reading the Screenshot
The chart above shows Helus Pharma (HELP) on the hourly clock with regular hours, captured after the close of 9 October, with the ribbon in a custom palette. The legend reads the daily EMA at 11.17, the daily VWMA at 11.04 and the weekly EMA at 11.88, followed by empty markers for the dormant daily and weekly forms. Price rallied through September with the ribbon riding above a rising weekly anchor and printed its 14.88 high on 18 September. The ribbon crossed beneath the anchor at month's end and followed price down to the 10.20 low of 8 October.
On 9 October price surged back through both daily lines, and the fill turned to show momentum leading volume. Price closed at 11.78, just beneath the weekly anchor at 11.88. A close back above the anchor would convert a sharp bounce into a reclaim, while a rejection would leave the anchor marking the boundary between a pullback and damage. The instrument does not answer that question; it shows where the answer will be printed.
FUMAs is a supplementary instrument. It reports where slower consensus lies and whether momentum or volume leads, and it leaves the trigger to the trader's own method. A trend trail, a volume profile and bar-by-bar volume analysis supply push, location and participation, which the averages cannot measure. Nothing in this description or in the script is financial advice, and past behavior of the averages does not predict future prices.
The Day Is a Convention
The ribbon defines a day as 1,440 minutes, which is literally true for crypto and quietly false for a regular-hours stock. On HELP's hourly chart, the 24-bar daily lines span between three and four sessions, and the 120-bar weekly anchor spans more than three weeks of trading. That stretch happens to suit equities, where pullback trading wants a slower consensus than one session can supply.
The deeper point concerns every average on every chart. A moving average is a claim on how long a market remembers, and a length typed in bars makes that claim without stating its unit. FUMAs states the unit and converts it, and in doing so it exposes the question every other average quietly answers for the trader, which is whose day, and whose week, the line is counting.

adrian dyer
Pernyataan Penyangkalan
Informasi dan publikasi ini tidak dimaksudkan, dan bukan merupakan, saran atau rekomendasi keuangan, investasi, trading, atau jenis lainnya yang diberikan atau didukung oleh TradingView. Baca selengkapnya di Ketentuan Penggunaan.
adrian dyer
Pernyataan Penyangkalan
Informasi dan publikasi ini tidak dimaksudkan, dan bukan merupakan, saran atau rekomendasi keuangan, investasi, trading, atau jenis lainnya yang diberikan atau didukung oleh TradingView. Baca selengkapnya di Ketentuan Penggunaan.