Composite Index-L (Momentum Lifecycle)
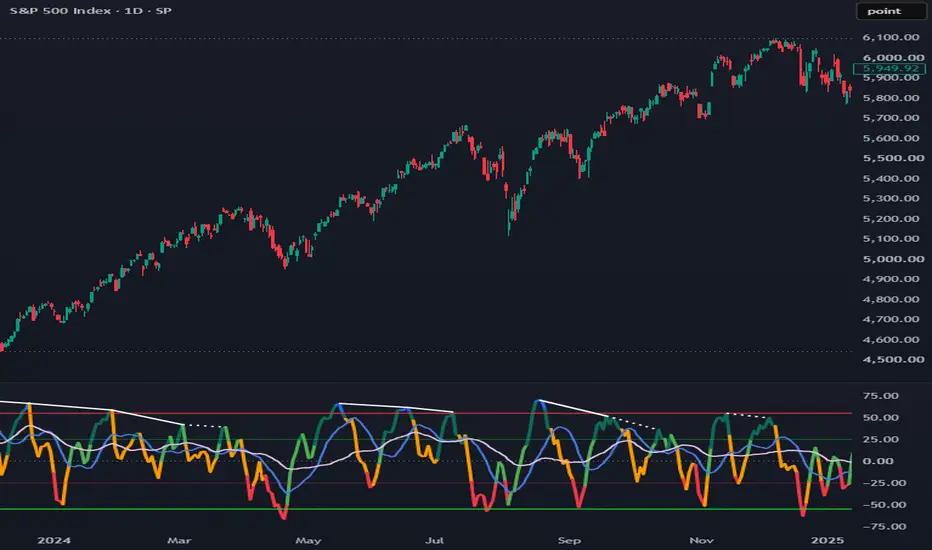
Composite Index-L (Momentum Lifecycle)
█ OVERVIEW
Composite Index-L plots Constance Brown's Composite Index in a separate pane, zero-centered, and restates it inside the momentum lifecycle framework that Alex Spiroglou developed for the MACD-V. The thesis in one sentence: because the Composite Index is built entirely from RSI values it is already normalized across symbols and across time, so it can carry objective momentum bands and a color-coded lifecycle state machine without any volatility division.
The script draws the centered Composite Index with lifecycle state colors, a 13-period signal average, a 33-period slow average, adjustable neutral and risk bands, automatic pivot-based divergence lines against price, and an optional second divergence engine based on regression slope disagreement between the Composite Index and the 14-period RSI.
█ HISTORY / BACKGROUND
The Composite Index was created by Constance Brown and is documented in "Technical Analysis for the Trading Professional" and "The Composite Index". It adds the 9-bar momentum of the 14-period RSI to a 3-bar average of the 3-period RSI. The momentum term lets the indicator register thrust that the bounded RSI compresses, which is why Brown used it primarily to expose divergences that the RSI itself fails to show. A widely used public Pine implementation of the Composite Index was published on TradingView by LazyBear, and that implementation is the ancestor of the base calculation used here. Credit for the original Composite Index concept and formula belongs to Constance Brown, and credit for the original public Pine version belongs to LazyBear.
The lifecycle framework comes from the MACD-V work of Alex Spiroglou (TradingView user AlexSpiroglou), who normalized the MACD by average true range and then defined objective ranges, range rules, and a momentum lifecycle map on the normalized values. This script does not copy the MACD-V calculation. It ports the framework: fitted bands, named momentum states, a ranging detector, and state persistence.
The design decision that joins the two: the MACD needs ATR division because it is denominated in price. The Composite Index is denominated in RSI points, which are dimensionless, so the normalization step is unnecessary and would be dimensionally wrong. What the Composite Index lacked was the framework layer, and that is what this script adds.
█ HOW IT WORKS
Step 1. Compute RSI(source, 14). Take its 9-bar momentum. Compute RSI(source, 3) and smooth it with a 3-bar simple moving average.
Step 2. Add the two terms and subtract 50. The momentum term is naturally centered at zero and the smoothed fast RSI is centered near 50, so the subtraction centers the whole indicator on a zero equilibrium line. Shapes and crossings are identical to the classic Composite Index; only the axis shifts.
Step 3. Compute the signal line as a 13-bar simple moving average of the centered value, and a slow context line as a 33-bar simple moving average. These are Brown's original averages.
Step 4. Classify every bar into a lifecycle state using the band inputs and the signal line. Above the risk band with a minimum number of consecutive bars beyond it: Risk, colored blue. Between the neutral band and the risk band while above the signal line: Rallying, dark teal. Below the neutral band while above the signal line: Rebounding, green. The mirror states below the signal line are Retracing (orange) and Rundown (red), with a confirmed oversold Risk state in blue. When the value stays inside the neutral band for a set number of consecutive bars the line turns gray to mark a Ranging market. When the value equals the signal line exactly the previous state is held.
Step 5. Detect pivot divergences. An oscillator pivot requires 9 bars of dominance on the left and 5 confirmation bars on the right. Two consecutive pivots must be at least 9 and at most 50 bars apart. A bullish divergence is a lower low in price with a higher low in the oscillator; a bearish divergence is a higher high in price with a lower high in the oscillator. Price is measured on closes by default, per Brown, with an option to use highs and lows instead. Confirmed divergences are drawn as lines connecting the two oscillator pivots. A line is solid when its starting pivot sits beyond the risk band and dotted when the starting pivot sits inside it.
Step 6. Optionally run the second divergence engine. It fits a 6-bar linear regression to the centered Composite Index and another to the 14-period RSI and compares their slopes. Composite slope up while RSI slope is down is a positive divergence; the inverse is a negative divergence. The condition persists while the slopes continue to disagree. An optional dead band suppresses the condition while the indicator is near zero. A percent-swing tracker (9 percent retracement with a 3-bar minimum reversal) timestamps price swings; a divergence that begins within 2 bars of the latest confirmed swing pivot is marked with a solid triangle, later onsets with a faded triangle.
█ HOW TO USE
The band defaults were fitted on daily data, so the daily timeframe is the reference resolution. The script runs on any timeframe, but distributions differ across resolutions, and the band inputs exist so you can refit them to your own market and timeframe.
Reading the main line. The line color is the current momentum state. Green family colors mean the indicator is above its signal line: dark teal (Rallying) means momentum is strong and rising, plain green (Rebounding) means momentum is recovering from below the neutral band. Warm colors mean the indicator is below its signal line: orange (Retracing) means a pullback from strength, red (Rundown) means downside momentum between the neutral and risk bands. Blue means Risk: the indicator has spent several consecutive bars beyond the risk band, the zone where moves have historically been overstretched. Gray means the market has been stuck inside the neutral band for many bars and is ranging; treat directional signals with less weight there.
Reading the bands. The inner lines are the neutral band. Inside them, directional conviction is low. The outer lines are the risk band. Beyond them, momentum is stretched relative to its fitted distribution. Because the Risk state requires persistence, a single one-bar spike beyond the band keeps its trend color and only a sustained excursion turns blue.
Reading the averages. The blue signal line is the crossover reference for the state machine. The lavender slow average shows the larger momentum backdrop; the indicator holding above a rising slow average is a stronger backdrop than the same reading below a falling one.
Reading the pivot divergence lines. A white line connecting two oscillator pivots means the oscillator disagreed with price across those two swings. Solid lines start from beyond the risk band and mark divergences that originate at an extreme. Dotted lines start inside the bands and mark Brown's mid-range class. The line appears 5 bars after the second pivot because pivots need right-side confirmation; the line is drawn back to the true pivot positions. Optional Bull and Bear labels can be enabled at the confirming pivot.
Reading the thesis engine, when enabled. Green background shading means the Composite Index is rising while the RSI is falling over the regression window, a positive divergence; red shading is the negative case. A triangle marks the first bar of each episode. A solid triangle means the episode began close to a fresh confirmed price swing, which is the timely case; a faded triangle means the onset came later.
Alerts. Seven alert conditions are available: confirmed overbought Risk, confirmed oversold Risk, signal line cross, bullish pivot divergence, bearish pivot divergence, thesis buy onset, and thesis sell onset. All fire on confirmed conditions.
█ SETTINGS
Composite Index group
• Source: input series, default close.
• RSI Length: main RSI period, default 14.
• RSI Momentum Length: momentum lookback on the main RSI, default 9.
• Fast RSI Length: short RSI period, default 3.
• Fast RSI Smoothing (SMA): average applied to the short RSI, default 3.
• Signal / Fast Average Length: signal line period, default 13.
• Slow Average Length: slow context line period, default 33.
Lifecycle group
• Neutral Band (+/-): inner band level, default 25. Roughly half of daily readings fell inside this band in the fitting sample.
• Risk Band (+/-): outer band level, default 55. The fitted 95 percent coverage level was 60; the default of 55 trades a wider tail for earlier warning.
• Ranging Bars: consecutive bars inside the neutral band before the gray Ranging state, default 20.
• Risk Persistence (bars): consecutive bars beyond the risk band required to confirm the Risk state, default 3. A value of 1 restores classic single-bar behavior.
Style group
• Lifecycle Colors: on by default. Off plots the indicator as a plain yellow line while the bands, states, and alerts keep working.
Divergence (Pivot) group
• Show Pivot Divergences: master toggle for detection display, default on.
• Show Extreme-Origin Lines (Solid): visibility of divergence lines starting beyond the risk band, default on.
• Show Mid-Range Lines (Dotted): visibility of divergence lines starting inside the risk band, default on.
• Use Close for Price Pivots (Brown): price basis on closes, default on. Off compares bar highs and lows.
• Pivot Lookback Left: left dominance bars for an oscillator pivot, default 9.
• Pivot Lookback Right: right confirmation bars, default 5.
• Max Bars Between Pivots: upper spacing limit for a valid pair, default 50.
• Min Bars Between Pivots: lower spacing limit, default 9.
• Divergence Labels: Bull and Bear markers at the confirming pivot, default off.
• Divergence Line Color: default white.
Divergence (Thesis) group
• Show Thesis Divergences: master toggle, default off.
• Regression Bars: linear regression window, default 6.
• Dead-Band Reset: suppresses the signal while the indicator is near zero, default off.
• Dead-Band (+/-): the suppression band level, default 10.
• Swing Retracement %: reversal threshold of the percent-swing tracker, default 9.0. Reduce on lower-volatility instruments so the swing degree matches.
• Swing Reversal Bars (min): minimum bars from the swing extreme before a reversal can confirm, default 3.
• Timely Proximity (bars): maximum distance from the latest confirmed swing pivot for a solid onset marker, default 2.
█ WHAT MAKES IT ORIGINAL
The script is not a restyled Composite Index and not a MACD-V clone. The original contribution is the transfer of a normalized-momentum framework onto an indicator that is normalized by construction rather than by division. Specifically: the Composite Index is zero-centered so that symmetric bands are meaningful; band levels are treated as distribution statistics with stated coverage targets rather than arbitrary lines; a six-state lifecycle machine with an explicit ranging detector and a persistence requirement classifies every bar; the persistence requirement addresses a structural property of the Composite Index, which reverts from extremes within a few bars and would otherwise flood a threshold with one-bar events; pivot divergences follow Brown's own doctrine (close basis, spacing tied to the momentum window) and are classified by the location of their origin pivot relative to the risk band; and a second, independent divergence definition from Brown's later research, slope disagreement against the RSI rather than against price, is implemented alongside the classic pivot method with a swing-proximity quality flag.
█ NOTES / LIMITATIONS
• The indicator plots in a separate pane, not on the chart.
• Values are na until the longest lookback is filled. Symbols with very short history will show a late-starting or empty plot.
• A pivot divergence cannot exist before its confirming pivot. With the default right lookback of 5, the line appears 5 bars after the oscillator pivot and is drawn back to it. Once drawn, lines do not repaint.
• The thesis-mode timeliness flag depends on a swing pivot that only confirms after the reversal completes, so a faded onset marker can upgrade to solid on the live bar. The divergence condition itself does not look ahead.
• On the live bar all states and conditions follow the current price and settle at bar close, standard Pine behavior.
• Divergence lines are capped at 500 objects; on very long histories the oldest lines are dropped.
• The band defaults were fitted on daily data from a broad equity sample and a volatility index. Other timeframes and asset classes work, but their distributions differ, and the bands are exposed as inputs so they can be refitted.
• The script uses no higher-timeframe requests and no lookahead.
█ OVERVIEW
Composite Index-L plots Constance Brown's Composite Index in a separate pane, zero-centered, and restates it inside the momentum lifecycle framework that Alex Spiroglou developed for the MACD-V. The thesis in one sentence: because the Composite Index is built entirely from RSI values it is already normalized across symbols and across time, so it can carry objective momentum bands and a color-coded lifecycle state machine without any volatility division.
The script draws the centered Composite Index with lifecycle state colors, a 13-period signal average, a 33-period slow average, adjustable neutral and risk bands, automatic pivot-based divergence lines against price, and an optional second divergence engine based on regression slope disagreement between the Composite Index and the 14-period RSI.
█ HISTORY / BACKGROUND
The Composite Index was created by Constance Brown and is documented in "Technical Analysis for the Trading Professional" and "The Composite Index". It adds the 9-bar momentum of the 14-period RSI to a 3-bar average of the 3-period RSI. The momentum term lets the indicator register thrust that the bounded RSI compresses, which is why Brown used it primarily to expose divergences that the RSI itself fails to show. A widely used public Pine implementation of the Composite Index was published on TradingView by LazyBear, and that implementation is the ancestor of the base calculation used here. Credit for the original Composite Index concept and formula belongs to Constance Brown, and credit for the original public Pine version belongs to LazyBear.
The lifecycle framework comes from the MACD-V work of Alex Spiroglou (TradingView user AlexSpiroglou), who normalized the MACD by average true range and then defined objective ranges, range rules, and a momentum lifecycle map on the normalized values. This script does not copy the MACD-V calculation. It ports the framework: fitted bands, named momentum states, a ranging detector, and state persistence.
The design decision that joins the two: the MACD needs ATR division because it is denominated in price. The Composite Index is denominated in RSI points, which are dimensionless, so the normalization step is unnecessary and would be dimensionally wrong. What the Composite Index lacked was the framework layer, and that is what this script adds.
█ HOW IT WORKS
Step 1. Compute RSI(source, 14). Take its 9-bar momentum. Compute RSI(source, 3) and smooth it with a 3-bar simple moving average.
Step 2. Add the two terms and subtract 50. The momentum term is naturally centered at zero and the smoothed fast RSI is centered near 50, so the subtraction centers the whole indicator on a zero equilibrium line. Shapes and crossings are identical to the classic Composite Index; only the axis shifts.
Step 3. Compute the signal line as a 13-bar simple moving average of the centered value, and a slow context line as a 33-bar simple moving average. These are Brown's original averages.
Step 4. Classify every bar into a lifecycle state using the band inputs and the signal line. Above the risk band with a minimum number of consecutive bars beyond it: Risk, colored blue. Between the neutral band and the risk band while above the signal line: Rallying, dark teal. Below the neutral band while above the signal line: Rebounding, green. The mirror states below the signal line are Retracing (orange) and Rundown (red), with a confirmed oversold Risk state in blue. When the value stays inside the neutral band for a set number of consecutive bars the line turns gray to mark a Ranging market. When the value equals the signal line exactly the previous state is held.
Step 5. Detect pivot divergences. An oscillator pivot requires 9 bars of dominance on the left and 5 confirmation bars on the right. Two consecutive pivots must be at least 9 and at most 50 bars apart. A bullish divergence is a lower low in price with a higher low in the oscillator; a bearish divergence is a higher high in price with a lower high in the oscillator. Price is measured on closes by default, per Brown, with an option to use highs and lows instead. Confirmed divergences are drawn as lines connecting the two oscillator pivots. A line is solid when its starting pivot sits beyond the risk band and dotted when the starting pivot sits inside it.
Step 6. Optionally run the second divergence engine. It fits a 6-bar linear regression to the centered Composite Index and another to the 14-period RSI and compares their slopes. Composite slope up while RSI slope is down is a positive divergence; the inverse is a negative divergence. The condition persists while the slopes continue to disagree. An optional dead band suppresses the condition while the indicator is near zero. A percent-swing tracker (9 percent retracement with a 3-bar minimum reversal) timestamps price swings; a divergence that begins within 2 bars of the latest confirmed swing pivot is marked with a solid triangle, later onsets with a faded triangle.
█ HOW TO USE
The band defaults were fitted on daily data, so the daily timeframe is the reference resolution. The script runs on any timeframe, but distributions differ across resolutions, and the band inputs exist so you can refit them to your own market and timeframe.
Reading the main line. The line color is the current momentum state. Green family colors mean the indicator is above its signal line: dark teal (Rallying) means momentum is strong and rising, plain green (Rebounding) means momentum is recovering from below the neutral band. Warm colors mean the indicator is below its signal line: orange (Retracing) means a pullback from strength, red (Rundown) means downside momentum between the neutral and risk bands. Blue means Risk: the indicator has spent several consecutive bars beyond the risk band, the zone where moves have historically been overstretched. Gray means the market has been stuck inside the neutral band for many bars and is ranging; treat directional signals with less weight there.
Reading the bands. The inner lines are the neutral band. Inside them, directional conviction is low. The outer lines are the risk band. Beyond them, momentum is stretched relative to its fitted distribution. Because the Risk state requires persistence, a single one-bar spike beyond the band keeps its trend color and only a sustained excursion turns blue.
Reading the averages. The blue signal line is the crossover reference for the state machine. The lavender slow average shows the larger momentum backdrop; the indicator holding above a rising slow average is a stronger backdrop than the same reading below a falling one.
Reading the pivot divergence lines. A white line connecting two oscillator pivots means the oscillator disagreed with price across those two swings. Solid lines start from beyond the risk band and mark divergences that originate at an extreme. Dotted lines start inside the bands and mark Brown's mid-range class. The line appears 5 bars after the second pivot because pivots need right-side confirmation; the line is drawn back to the true pivot positions. Optional Bull and Bear labels can be enabled at the confirming pivot.
Reading the thesis engine, when enabled. Green background shading means the Composite Index is rising while the RSI is falling over the regression window, a positive divergence; red shading is the negative case. A triangle marks the first bar of each episode. A solid triangle means the episode began close to a fresh confirmed price swing, which is the timely case; a faded triangle means the onset came later.
Alerts. Seven alert conditions are available: confirmed overbought Risk, confirmed oversold Risk, signal line cross, bullish pivot divergence, bearish pivot divergence, thesis buy onset, and thesis sell onset. All fire on confirmed conditions.
█ SETTINGS
Composite Index group
• Source: input series, default close.
• RSI Length: main RSI period, default 14.
• RSI Momentum Length: momentum lookback on the main RSI, default 9.
• Fast RSI Length: short RSI period, default 3.
• Fast RSI Smoothing (SMA): average applied to the short RSI, default 3.
• Signal / Fast Average Length: signal line period, default 13.
• Slow Average Length: slow context line period, default 33.
Lifecycle group
• Neutral Band (+/-): inner band level, default 25. Roughly half of daily readings fell inside this band in the fitting sample.
• Risk Band (+/-): outer band level, default 55. The fitted 95 percent coverage level was 60; the default of 55 trades a wider tail for earlier warning.
• Ranging Bars: consecutive bars inside the neutral band before the gray Ranging state, default 20.
• Risk Persistence (bars): consecutive bars beyond the risk band required to confirm the Risk state, default 3. A value of 1 restores classic single-bar behavior.
Style group
• Lifecycle Colors: on by default. Off plots the indicator as a plain yellow line while the bands, states, and alerts keep working.
Divergence (Pivot) group
• Show Pivot Divergences: master toggle for detection display, default on.
• Show Extreme-Origin Lines (Solid): visibility of divergence lines starting beyond the risk band, default on.
• Show Mid-Range Lines (Dotted): visibility of divergence lines starting inside the risk band, default on.
• Use Close for Price Pivots (Brown): price basis on closes, default on. Off compares bar highs and lows.
• Pivot Lookback Left: left dominance bars for an oscillator pivot, default 9.
• Pivot Lookback Right: right confirmation bars, default 5.
• Max Bars Between Pivots: upper spacing limit for a valid pair, default 50.
• Min Bars Between Pivots: lower spacing limit, default 9.
• Divergence Labels: Bull and Bear markers at the confirming pivot, default off.
• Divergence Line Color: default white.
Divergence (Thesis) group
• Show Thesis Divergences: master toggle, default off.
• Regression Bars: linear regression window, default 6.
• Dead-Band Reset: suppresses the signal while the indicator is near zero, default off.
• Dead-Band (+/-): the suppression band level, default 10.
• Swing Retracement %: reversal threshold of the percent-swing tracker, default 9.0. Reduce on lower-volatility instruments so the swing degree matches.
• Swing Reversal Bars (min): minimum bars from the swing extreme before a reversal can confirm, default 3.
• Timely Proximity (bars): maximum distance from the latest confirmed swing pivot for a solid onset marker, default 2.
█ WHAT MAKES IT ORIGINAL
The script is not a restyled Composite Index and not a MACD-V clone. The original contribution is the transfer of a normalized-momentum framework onto an indicator that is normalized by construction rather than by division. Specifically: the Composite Index is zero-centered so that symmetric bands are meaningful; band levels are treated as distribution statistics with stated coverage targets rather than arbitrary lines; a six-state lifecycle machine with an explicit ranging detector and a persistence requirement classifies every bar; the persistence requirement addresses a structural property of the Composite Index, which reverts from extremes within a few bars and would otherwise flood a threshold with one-bar events; pivot divergences follow Brown's own doctrine (close basis, spacing tied to the momentum window) and are classified by the location of their origin pivot relative to the risk band; and a second, independent divergence definition from Brown's later research, slope disagreement against the RSI rather than against price, is implemented alongside the classic pivot method with a swing-proximity quality flag.
█ NOTES / LIMITATIONS
• The indicator plots in a separate pane, not on the chart.
• Values are na until the longest lookback is filled. Symbols with very short history will show a late-starting or empty plot.
• A pivot divergence cannot exist before its confirming pivot. With the default right lookback of 5, the line appears 5 bars after the oscillator pivot and is drawn back to it. Once drawn, lines do not repaint.
• The thesis-mode timeliness flag depends on a swing pivot that only confirms after the reversal completes, so a faded onset marker can upgrade to solid on the live bar. The divergence condition itself does not look ahead.
• On the live bar all states and conditions follow the current price and settle at bar close, standard Pine behavior.
• Divergence lines are capped at 500 objects; on very long histories the oldest lines are dropped.
• The band defaults were fitted on daily data from a broad equity sample and a volatility index. Other timeframes and asset classes work, but their distributions differ, and the bands are exposed as inputs so they can be refitted.
• The script uses no higher-timeframe requests and no lookahead.

Pernyataan Penyangkalan
Informasi dan publikasi ini tidak dimaksudkan, dan bukan merupakan, saran atau rekomendasi keuangan, investasi, trading, atau jenis lainnya yang diberikan atau didukung oleh TradingView. Baca selengkapnya di Ketentuan Penggunaan.
Pernyataan Penyangkalan
Informasi dan publikasi ini tidak dimaksudkan, dan bukan merupakan, saran atau rekomendasi keuangan, investasi, trading, atau jenis lainnya yang diberikan atau didukung oleh TradingView. Baca selengkapnya di Ketentuan Penggunaan.